

-
We reviewed 685 funds across four Investment Association (IA) mixed investment and flexible investment sectors.
-
In the IA Mixed Investment 20–60% Shares sector, the highest five year return was 68.64%, while the lowest was a loss of 6.44%.
-
Of the 575 funds with five year histories, 158, representing 27.5%, returned less than the 18.60% average recorded by the IA Short Term Money Market sector over that period.
-
Around six in ten funds in each of the four sectors received a 1 or 2 star Yodelar Rating in the supplied data.
-
Among funds with sufficient performance history, 68 ranked in the top quarter of their sectors over 1, 3 and 5 years, while 81 ranked in the bottom quarter across all three periods.
Multi asset funds combine investments such as shares, bonds and cash within one fund. For investors who want a managed mix of investments rather than choosing each part themselves, that simplicity can be appealing.
However, leaving investment decisions to a fund manager does not remove the need to review the result. A fund described as cautious or balanced can still deliver a very different experience from another fund with a similar description.
Our latest analysis covers 685 funds across four Investment Association (IA) sectors, using performance data to 30th September 2026. The differences between funds were substantial, even within the same sector.
For investors using these funds in pensions, ISAs or retirement portfolios, the useful question is not simply whether the account has grown. It is whether the fund has performed competitively, what risks it has taken and whether it still supports the purpose for which it was selected.

The Four Multi Asset Sectors At A Glance
The three Mixed Investment sectors set limits on the proportion a fund can invest in shares. Flexible Investment gives managers greater freedom, including the ability to invest entirely in shares. These sector classifications describe investment limits, not a personal risk rating.
|
IA sector |
Funds analysed |
Average 1 year return |
Average 3 year return |
Average 5 year return |
|---|---|---|---|---|
|
Mixed Investment 0–35% Shares |
82 |
5.67% |
23.34% |
13.12% |
|
Mixed Investment 20–60% Shares |
200 |
8.99% |
30.85% |
22.31% |
|
Mixed Investment 40–85% Shares |
231 |
13.20% |
41.25% |
35.07% |
|
Flexible Investment |
172 |
13.32% |
42.43% |
35.96% |
Performance figures up to 30th September 2026. Source: hub.yodelar.com. Past performance is not a guide to future returns.
Over this five year period, the sectors permitting greater exposure to shares recorded higher average returns. However, the figures do not show how much each fund actually held in shares throughout the period or establish what caused its result.
A fund with less invested in shares may have been selected for a different purpose. Its lower return does not automatically make it a weaker choice, just as a higher return does not establish that another fund took an appropriate level of risk.
The sector averages provide context. The next step is to examine the differences between funds within each group.

Different Results Within The Same Sector
The tables below show the three highest and two lowest five year returns in the two Mixed Investment sectors containing the most funds in this review.
Funds in the same sector can still differ in their investment mix, approach and risks. These are performance comparisons, not lists of interchangeable investments or recommendations.
IA Mixed Investment 20–60% Shares
|
Fund |
1 year return |
5 year return |
5 year sector rank |
Yodelar Rating |
|---|---|---|---|---|
|
Artemis Monthly Distribution I Inc |
17.07% |
68.64% |
1/171 |
4 stars |
|
Orbis Global Cautious Standard |
9.73% |
56.05% |
2/171 |
4 stars |
|
PIMCO GIS Balanced Income and Growth Institutional USD |
19.69% |
50.53% |
3/171 |
4 stars |
|
Liontrust Sustainable Future Defensive Managed 2 Inc |
2.49% |
-2.98% |
170/171 |
1 star |
|
AXA Ethical Distribution Z Acc |
6.41% |
-6.44% |
171/171 |
1 star |
Performance figures up to 30th September 2026. Source: hub.yodelar.com. Past performance is not a guide to future returns.
IA Mixed Investment 40–85% Shares
|
Fund |
1 year return |
5 year return |
5 year sector rank |
Yodelar Rating |
|---|---|---|---|---|
|
Orbis Global Balanced Standard |
18.27% |
106.09% |
1/195 |
5 stars |
|
True Potential SEI Aggressive A Inc |
21.40% |
74.62% |
2/195 |
4 stars |
|
Invesco Global Balanced Index (UK) No Trail Acc |
17.73% |
73.48% |
3/195 |
4 stars |
|
Baillie Gifford Managed B Acc |
7.31% |
2.83% |
194/195 |
1 star |
|
Liontrust Sustainable Future Cautious Managed 2 Inc |
3.40% |
0.42% |
195/195 |
1 star |
Performance figures up to 30th September 2026. Source: hub.yodelar.com. Past performance is not a guide to future returns.
In the IA Mixed Investment 40–85% Shares sector, the difference between the highest and lowest five year returns exceeded 105 percentage points. That is a substantial difference, but it should not be presented as a comparison between funds taking identical risks.
Different holdings, investment styles and restrictions on what a fund can buy may help explain its performance. The figures alone do not establish which factors caused a particular result or prove that a lower ranked fund was poorly managed.
Those explanations are nevertheless worth investigating. A fund near the bottom of its sector over five years deserves a current, specific review of its record and the reasons for continuing to hold it. That review should recognise meaningful differences between funds without allowing the sector label to substitute for scrutiny.
More Than A Quarter Returned Less Than Money Market Funds
Of the 575 multi asset funds with five year histories, 158 returned less than the 18.60% average recorded by the IA Short Term Money Market sector. That represents 27.5% of the funds with sufficient data.
This is a historical comparison, not evidence that money market funds are the right replacement. The investments have different objectives and risks, and their relative results can change over time. Money market funds are themselves investments, not bank deposits or guaranteed savings accounts.
The comparison is particularly relevant to understanding the results of funds with lower limits on share holdings. In IA Mixed Investment 0–35% Shares, the average five year return was 13.12%, below the money market sector average.
However, the data does not establish how much of that difference was caused by bonds, the choice of individual investments or other decisions. That requires a closer examination of the funds rather than a conclusion drawn from the sector averages.
For investors in cautious portfolios, particularly those taking withdrawals, the finding raises a useful question: has the fund delivered an acceptable result for its intended role and the risks taken? The answer needs more than a cautious label or a comparison with whichever investment performed best.

Consistency Across One, Three And Five Years
Among the 575 funds with complete one, three and five year records, 68 ranked in the top quarter of their sectors over all three periods. That represents 11.8%. A further 81, representing 14.1%, ranked in the bottom quarter across all three.
These figures identify funds with repeated strong or weak sector positions at the review date. They do not mean those funds held the same ranking in every individual year. The periods overlap, with the latest year included in both the three and five year figures.
Nor are these counts the same as the number of funds receiving a particular Yodelar Rating. The quartile comparison is a separate measure based on the ranking fields in the dataset.
For investors, repeated lower rankings are a reason to seek an explanation, not an automatic instruction to sell. The useful question is whether the pattern reflects an approach that still serves a purpose or a record that no longer supports the reason for holding the fund.

When A Multi Asset Fund Is The Whole Portfolio
Many investors hold a single multi asset fund as their entire pension or ISA. In practice, that one fund is their portfolio. Its asset mix, its manager's decisions and its performance determine the result of everything they have invested.
There is nothing wrong with that approach in principle. For smaller sums, or for investors who want one decision rather than many, it can be a reasonable way to obtain a diversified mix at low effort.
It is worth being clear, however, about what a multi asset fund is designed to do. Each fund is built to a single mandate for a broad group of investors, typically expressed as a share allocation range or a risk description. The manager does not know the circumstances of any individual holder. The fund cannot take account of an investor's other holdings, their tax position, the timing of their withdrawals, or how their objectives change over time.
That is not a criticism of the funds. It is a description of what they are. A fund labelled balanced or cautious has been built to a general definition of those words, and this review shows how widely results can differ between funds carrying similar labels. An investor relying on one fund is relying on one manager's interpretation of a generic brief.
A portfolio constructed by a financial adviser starts from a different point. The adviser's regulatory duty is to assess the individual client's objectives, investment period, capacity for loss and attitude to risk before recommending anything. The resulting portfolio can hold several funds across sectors and managers, so that performance does not rest on one manager's decisions, and it is reviewed on an ongoing basis against the client's circumstances rather than against a fixed mandate.
The practical differences for investors can be summarised as follows:
|
Single multi asset fund |
Advised portfolio |
|
|---|---|---|
|
Built around |
A general mandate for many investors |
An individual's objectives and circumstances |
|
Asset mix set by |
The fund manager, within the fund's limits |
The adviser, to the client's agreed risk level |
|
Manager risk |
Concentrated in one management team |
Can be spread across managers and funds |
|
Review |
Investor's own responsibility |
Part of an ongoing advice service |
|
Suitability |
Not assessed for the individual |
Assessed and documented by the adviser |
An advised portfolio also has costs, including advice and ongoing service charges, and it carries investment risk in the same way as any other portfolio. A diversified portfolio does not guarantee a better outcome than a single fund, and some multi asset funds have performed well against both their sectors and more complex alternatives. Whether advice represents good value depends on the individual's circumstances and the size of their investments.
The point is narrower than that. A multi asset fund is a product. A portfolio built and reviewed for a specific investor is a service. Investors whose entire savings rest on one fund should at least understand which of the two they have, and whether a generic mandate is still the right fit for their own situation.
Questions For Anyone Holding A Multi Asset Fund
The convenience of holding a managed mix of investments should not make the fund difficult to question. A useful review should address four points:
A useful review should address five points:
1. How has your fund ranked within its IA sector over one, three and five years, rather than simply whether it grew?
2. Where rankings have repeatedly been weak, what is the current explanation and does it still support the reason for holding the fund?
3. What does the fund invest in, and how have shares, bonds and other holdings affected its results?
4. Does the fund's current investment mix still match your objectives and ability to withstand losses?
5. If this fund is your whole portfolio, was it chosen for your circumstances, or because it was the available default?
These questions do not assume that every lower returning fund needs replacing. They help distinguish a holding that is behaving as expected from one whose record needs more attention.

Find Out How Your Funds Rank
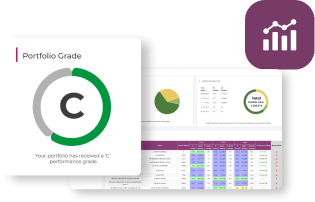
Our free portfolio analysis shows how the funds you hold have performed against their sector peers. Where sufficient history is available, it provides one, three and five year performance, sector rankings, sector average returns and Yodelar Ratings. It also shows the proportion of your portfolio in each rating band and an overall portfolio performance grade.
The ratings and grade describe historic performance. They do not assess personal suitability, guarantee future returns or establish whether an investment should be bought or sold.
Upload a recent portfolio statement or provide your fund names and the approximate amount invested in each. The service is free, with no obligation to make changes or proceed with financial advice.

Speak To An Adviser
Multi asset funds offer a convenient way to combine investments, but the latest data shows substantial differences between the results they have delivered.
Across the sectors reviewed, more than a quarter of funds with five year histories returned less than the short term money market sector average. Within individual sectors, the spread between the highest and lowest returns was also wide.
Those findings do not establish that cautious investing was a mistake or that the highest returning fund would have suited every investor. Funds in the same sector can take different risks and pursue different approaches.
They do establish why the performance of an individual holding deserves attention. Investors should understand how their fund has ranked, what explains its results and whether the reason for holding it remains convincing.
For investors whose whole pension or ISA sits in one multi asset fund, that review has a further dimension. A single fund asks one manager and one mandate to serve every holder equally. A portfolio built from a range of funds, selected and weighted around an investor's own objectives, investment period and tolerance for loss, and reviewed as those change, is constructed to a different standard. Many investors may find that approach a closer fit for their circumstances. Others may conclude that their existing fund continues to do what they need. Either way, the decision should rest on evidence rather than on the convenience of leaving things as they are.
A free portfolio analysis provides that evidence, showing how your current holdings have ranked against their peers. A no obligation call with an adviser from MKC Wealth can then establish whether a portfolio built around you would be a more suitable home for your investments.