

-
We reviewed 26 funds in the Investment Association India/Indian Subcontinent sector using figures to 30 September 2026.
-
Twenty-four recorded negative growth over the previous year. Matthews India and Schroder India Equity were the only two with positive results.
-
Average growth was -8.16% over one year, 2.93% over three years and 12.03% over five years.
-
Jupiter India and JGF-Jupiter India Select led the five year table, but neither was among the strongest funds over the latest year.
-
The accompanying download includes every fund reviewed, allowing investors to compare their own holding across several periods.
A difficult year can leave investors questioning a fund they previously felt confident holding. Is the loss part of a wider market setback, or has the fund fallen further behind its competitors? The answer matters before deciding whether to commit more money, look elsewhere or leave the investment unchanged.
For investors in Indian equities, the recent figures tell a different story from the longer term records. Some funds that led over five years were less competitive over the latest year. Others held up better recently but had a less convincing longer history.
Our review of the Investment Association (IA) India/Indian Subcontinent sector examines those differences. It shows which funds have ranked well, where closer scrutiny is warranted and what investors should understand before making their next decision.

India Sector Performance
Losses were widespread over the year to 30th September 2026, with 24 of the 26 funds recording negative growth. The sector average was -8.16%, although average growth remained positive over three and five years.
|
Period |
Average growth |
Funds with available data |
|---|---|---|
|
1 year |
-8.16% |
26 |
|
3 years |
2.93% |
24 |
|
5 years |
12.03% |
23 |
*Performance figures up to 30th September 2026. Source: hub.yodelar.com. Past performance is not a guide to future returns.
These are cumulative figures for overlapping periods ending on the same date. The one year result covers the previous 12 months, not the first nine months of 2026. The three and five year figures show growth over those full periods, not annual growth rates.
For an existing investor, both the recent and longer records matter. A positive five year result does not mean the investment grew steadily throughout that period. Equally, a negative year does not establish that a fund’s entire record has been weak.
The next question is how the individual fund compared with its sector peers.

India Fund Performance Summary
Among the 23 funds with five year histories, four received a 4 or 5 star Yodelar Rating, representing 17.4%. Fifteen received a 1 or 2 star rating, representing 65.2%. Three funds with shorter histories are included in the download but excluded from this summary.
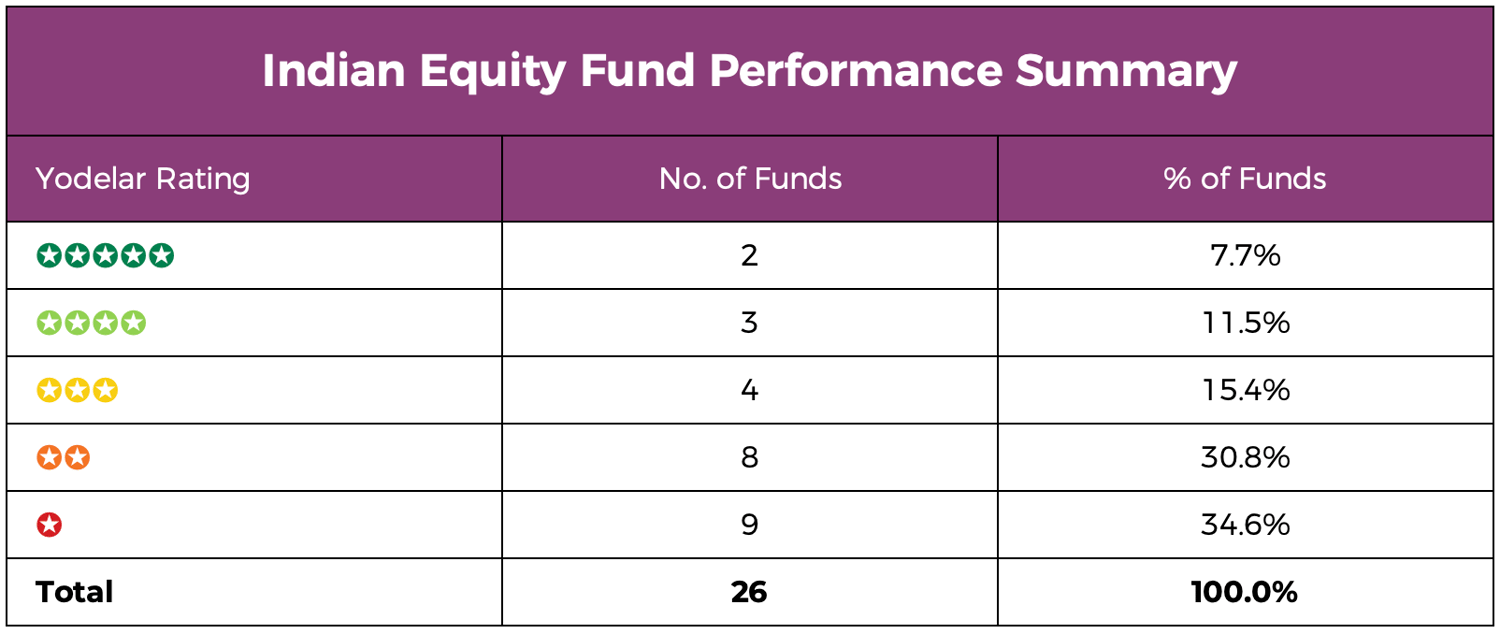
*Performance figures up to 30th September 2026. Source: hub.yodelar.com. Past performance is not a guide to future returns.
Yodelar Ratings describe historic performance against sector peers. They should be read alongside the individual period rankings and the fund’s investment approach. They are not recommendations, do not assess personal suitability and are not a guide to future returns.
How Yodelar Rates Fund Performance
India Funds Ranked By Performance
The table includes the five highest five year performers. This selection highlights different performance records. It is not a recommended portfolio, and the rankings do not account for differences in risk or investment approach.
| Fund | 1 year growth | 3 year growth | 5 year growth | 5 year sector rank | Yodelar Rating |
|---|---|---|---|---|---|
| Jupiter India I Acc | -7.94% | 22.54% | 59.48% | 1/23 | 4 stars |
| JGF-Jupiter India Select D Acc | -9.45% | 20.05% | 58.21% | 2/23 | 3 stars |
| Matthews India I Acc GBP | 0.52% | 15.90% | 32.59% | 3/23 | 5 stars |
| Nomura India Equity I USD | -5.54% | 7.46% | 22.02% | 4/23 | 4 stars |
| Ashoka WhiteOak India Opportunities D GBP | -4.16% | 10.66% | 17.40% | 5/23 | 5 stars |
*Performance figures up to 30th September 2026. Source: hub.yodelar.com. Past performance is not a guide to future returns.
Jupiter India
Jupiter India recorded five year growth of 59.48%, ranking first out of 23 funds. It also ranked first over three years, with growth of 22.54%. Its one year result was less competitive, with a loss of 7.94% placing it 11th out of 26 funds.
The managers look for growing businesses at prices they consider reasonable, rather than treating India’s growth prospects as a reason to buy at any price. The longer term rankings show how that approach performed against sector peers, but they did not prevent the fund from sharing in the sector’s recent losses. Investors should recognise the strength of the longer record without assuming it guarantees protection during a difficult year.
JGF-Jupiter India Select
JGF-Jupiter India Select ranked second over both three and five years, recording growth of 20.05% and 58.21%. Its one year loss of 9.45% placed 15th out of 26 funds, below the middle of the sector.
The Select strategy also places emphasis on the price paid for a company’s growth prospects. Its record illustrates why a leading five year position should not put a fund beyond review. Investors comparing it with Jupiter India should also check the exact fund and share class, rather than assume similarly named holdings provide an identical investment.
Matthews India
Matthews India recorded the strongest one year result in the supplied dataset, with growth of 0.52%. It also ranked third over three and five years, with growth of 15.90% and 32.59%. It received a 5 star Yodelar Rating.
The strategy invests across different company sizes, looking for well run businesses with lasting competitive strengths and the potential to grow. Its one year gain was small in absolute terms, but it stood out when almost every sector peer recorded a loss. That is an important distinction for investors: a comparatively strong result does not always come with a large positive percentage.

Nomura India Equity
Nomura India Equity recorded five year growth of 22.02%, ranking fourth out of 23 funds. Its three year growth of 7.46% placed seventh, while its one year loss of 5.54% ranked fifth out of 26.
The fund therefore remained among the more competitive sector peers across the periods reviewed, despite losing money over the latest year. For an existing investor, the loss and the relative ranking answer different questions. The loss describes what happened to the investment; the ranking shows that many competing funds delivered a weaker result.
Ashoka WhiteOak India Opportunities
Ashoka WhiteOak India Opportunities recorded five year growth of 17.40%, ranking fifth out of 23 funds. Its three year growth of 10.66% ranked sixth, while its one year loss of 4.16% placed fourth out of 26. It received a 5 star Yodelar Rating.
WhiteOak’s approach centres on selecting businesses at attractive prices rather than relying primarily on predictions about the economy or market direction. The results show competitive sector positions across the periods reviewed, but a strong ranking does not remove the risks associated with concentrating investments in one market.
Schroder India Equity
Schroder India Equity was the only fund other than Matthews India to record positive one year growth, at 0.27%. Its three year growth of 12.44% ranked fourth, while its five year growth of 7.03% placed 15th out of 23 funds.
Its recent relative record was therefore stronger than its five year position. An investor looking only at the latest year could reach a different conclusion from someone reviewing the longer period. Both deserve attention: recent resilience is useful evidence, but it should not replace examination of the full record.
JSS Equity India
JSS Equity India recorded the lowest five year result in the sector, with a loss of 10.55%. Its three year loss of 6.52% ranked 20th out of 24 funds, while its one year loss of 8.02% placed 12th out of 26.
The latest one year result was close to the sector average, but the longer record was weaker. Explaining the holding solely by reference to India’s recent difficulties would therefore miss an important part of the picture. Investors should understand the reasons for its three and five year results and whether the current approach still supports their reason for holding it.
What A Difficult Year Does Not Tell You
A falling fund price does not establish that an investment is now a bargain. Nor does a strong five year record establish that it is the right fund to add to today.
The figures show what happened. They do not tell us whether the companies held are attractively priced now, whether their prospects have improved or when a recovery might occur. Those questions require a current assessment of the investments, not simply an expectation that previous losses will be recovered.
There is also a difference between a fund following a less successful approach during a particular period and a fund being poorly managed. The sector groups investments focused on India and the wider Indian subcontinent, but it does not give every fund identical holdings or risks. The IA allows funds within this sector to invest solely in India or more broadly across the subcontinent.
That context should inform the review, not end it. Where a holding has repeatedly ranked poorly, investors should understand the explanation and whether it remains convincing.
Review The Fund And The Amount Invested
The findings raise two separate questions for an existing investor: has the fund performed competitively, and is the amount committed to it still appropriate for the wider plan?
A fund may rank well against sector peers while still representing more exposure to one market than an investor intended. Country focused funds can be more sensitive to developments in that country than investments spread across a wider range of markets.
Before adding money after a fall, consider what the additional investment would change. Would it increase reliance on India? When might the money be needed? Would a further loss affect planned spending or retirement decisions?
These questions do not assume India exposure should be reduced or avoided. They make sure the decision is connected to an objective rather than simply a wish to recover an earlier loss.
The same principle applies to retaining a fund. Keeping an investment can be a considered decision, but it should be supported by a current reason for holding it, not just the fact that it has been in the portfolio for years.
Download The Complete India Fund Report
The full report includes all 26 funds reviewed, with available performance figures, sector rankings, Yodelar Ratings and ongoing charges. It also identifies funds without complete three or five year histories.
Find your exact holding and see whether its record is stronger over the longer term, more competitive recently or weaker across several periods. The report provides research information, not a recommendation to buy, sell or switch.

Get A Free Portfolio Analysis
Before deciding what to do with one fund, understand how it fits alongside everything else you hold.
Our free portfolio analysis reviews available one-, three- and five-year performance, sector rankings and Yodelar Ratings across your investments. Where sufficient information is available, it can also highlight potential overlap between holdings and areas of concentration.
To get started, upload a recent portfolio statement or provide the names of your funds and their approximate values.
The analysis provides factual information about your portfolio. It does not constitute personal advice or a recommendation to buy, sell or switch investments. There is no obligation to make changes to your portfolio or to proceed with any advice service.
Upload Your Portfolio For Free Analysis
Speak To An Adviser
To discuss the findings alongside your retirement plans, income needs or investment objectives, book a no obligation call with an adviser from our advice partner, MKC Wealth.
Any personal recommendation would follow a fuller assessment of your circumstances, objectives, attitude to risk and ability to withstand losses. The risks, costs and ongoing services would be explained before you decide whether to proceed.
Book A No Obligation Call
Summary
India’s difficult year produced different questions for different investors. The Jupiter funds retained leading longer term records despite recent losses. Matthews combined a modest positive year with competitive longer term positions, while JSS recorded a substantially weaker result over three and five years.
Those records should not lead to the same explanation or an automatic investment decision. The useful response is to examine your own fund, understand the reasons behind its performance and consider how much depends on that holding within the wider portfolio.
A difficult market is not a reason to abandon proper analysis. It is when a clear assessment of the fund and the plan behind it becomes particularly valuable.

Source And Methodology
Performance figures, sector rankings and Yodelar Ratings are taken from the October 2026 fund workbook, using figures to 30th September 2026.
The review covers 26 fund entries in the Investment Association India/Indian Subcontinent sector. Twenty-four have three year records and 23 have five year records. Averages use funds with available data for each period, with each fund counted equally rather than weighted by the amount invested.
The rating summary covers the 23 funds with five year histories. Ratings and sector rankings are reproduced as supplied and have not been recalculated.
The featured table contains the five highest five year growth figures in the reviewed dataset. The commentary additionally discusses the other fund with positive one year growth and the fund with the lowest five year result. Fund and share class names are retained from the source.
Figures show cumulative growth over the stated periods. They do not separately measure income payments, personal suitability or performance adjusted for risk. Yodelar Ratings describe historic performance and are not recommendations or a guide to future returns.