


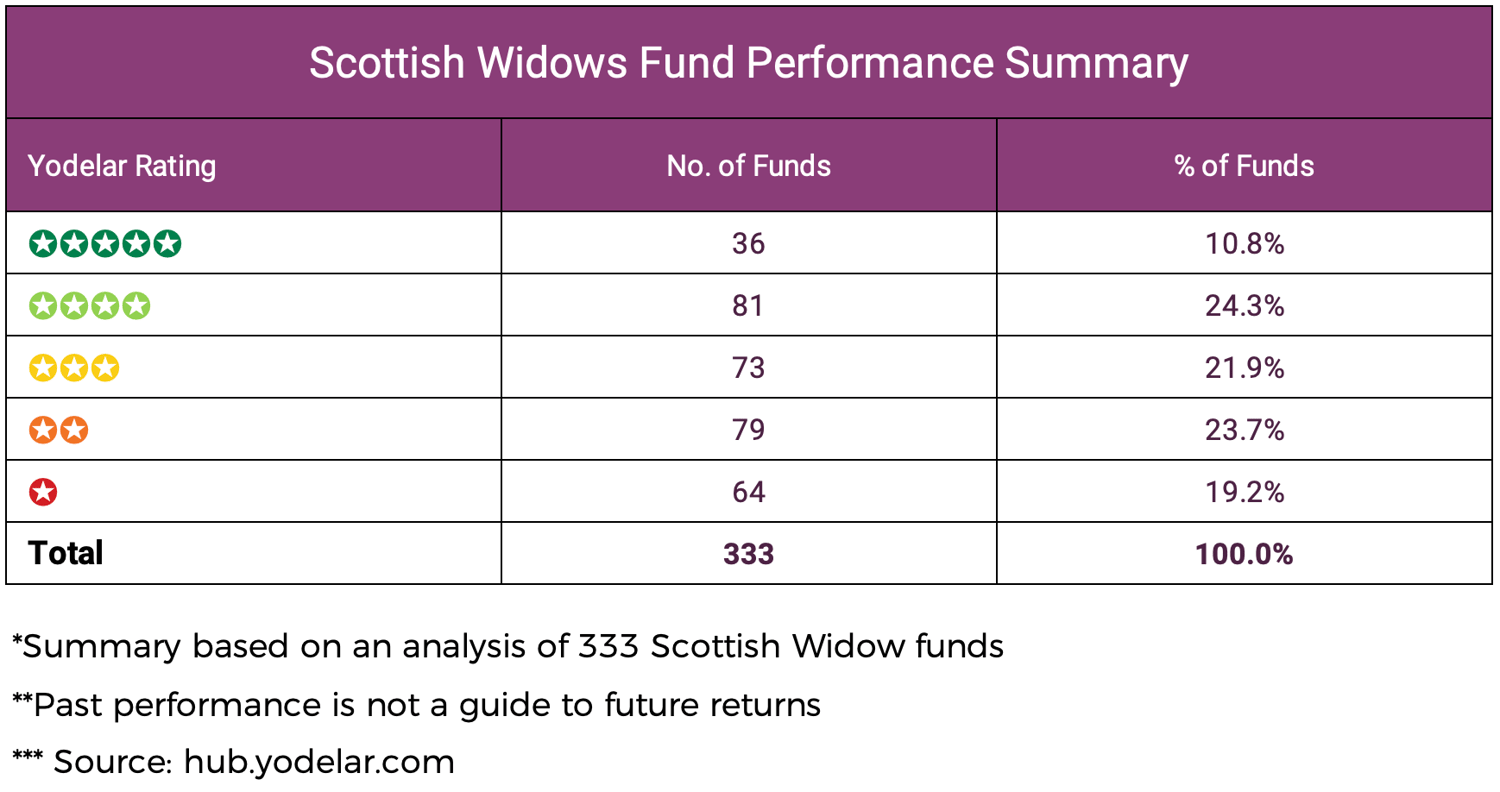
- Analysis of 333 Scottish Widows funds identified a wide variation in performance, with only a minority achieving consistently strong performance.
- 36 funds received a 5 star Yodelar rating and 81 received 4 stars, while more than 40% of the range was rated 1 or 2 stars.
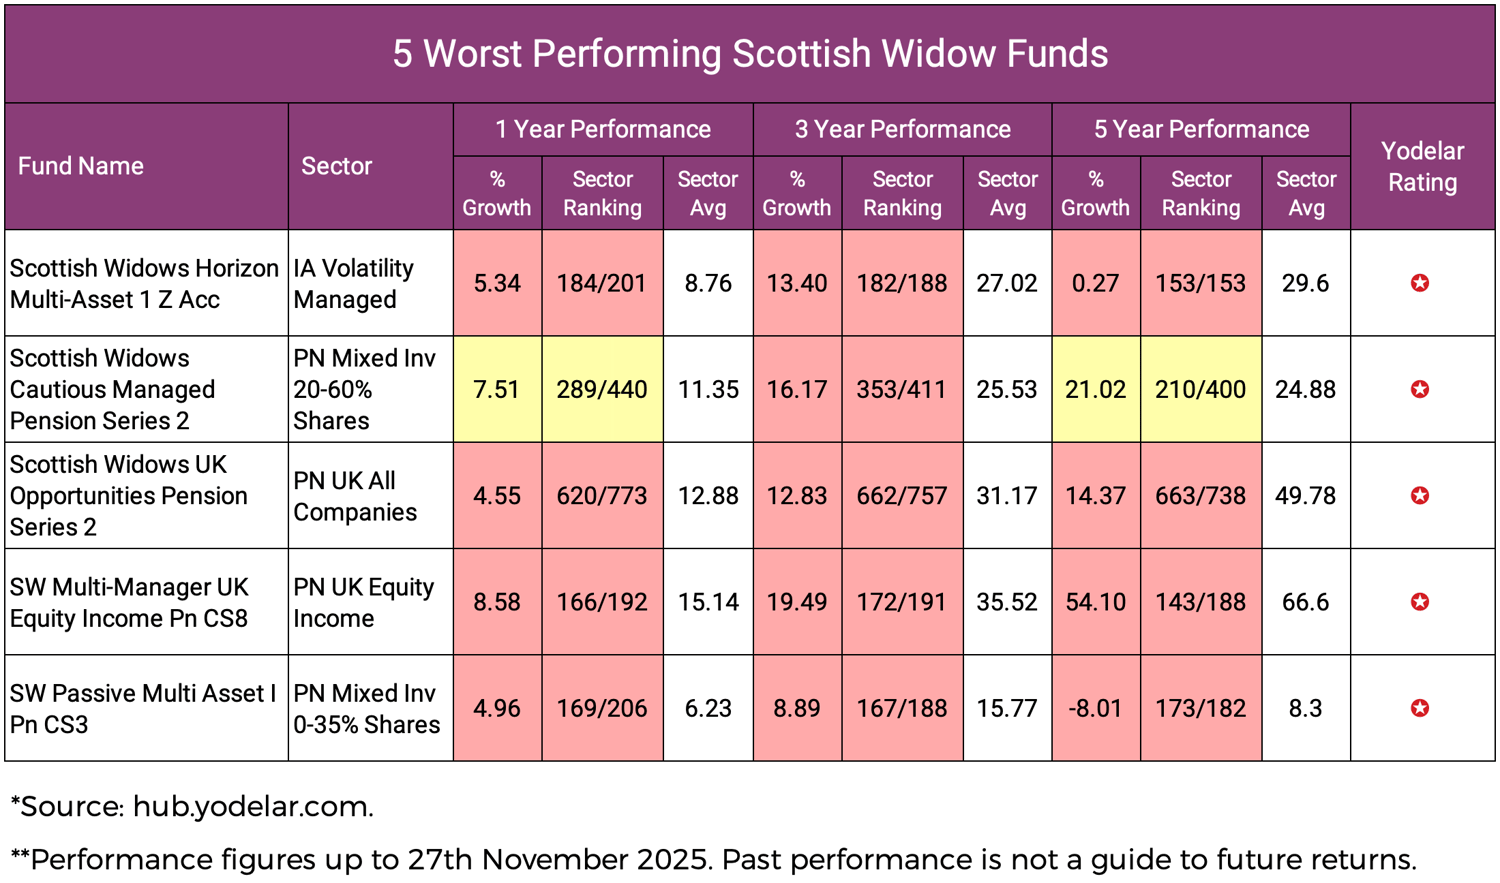
- The 5 weakest funds consistently delivered returns below their sector averages across 1 year, 3 year and 5 year periods.
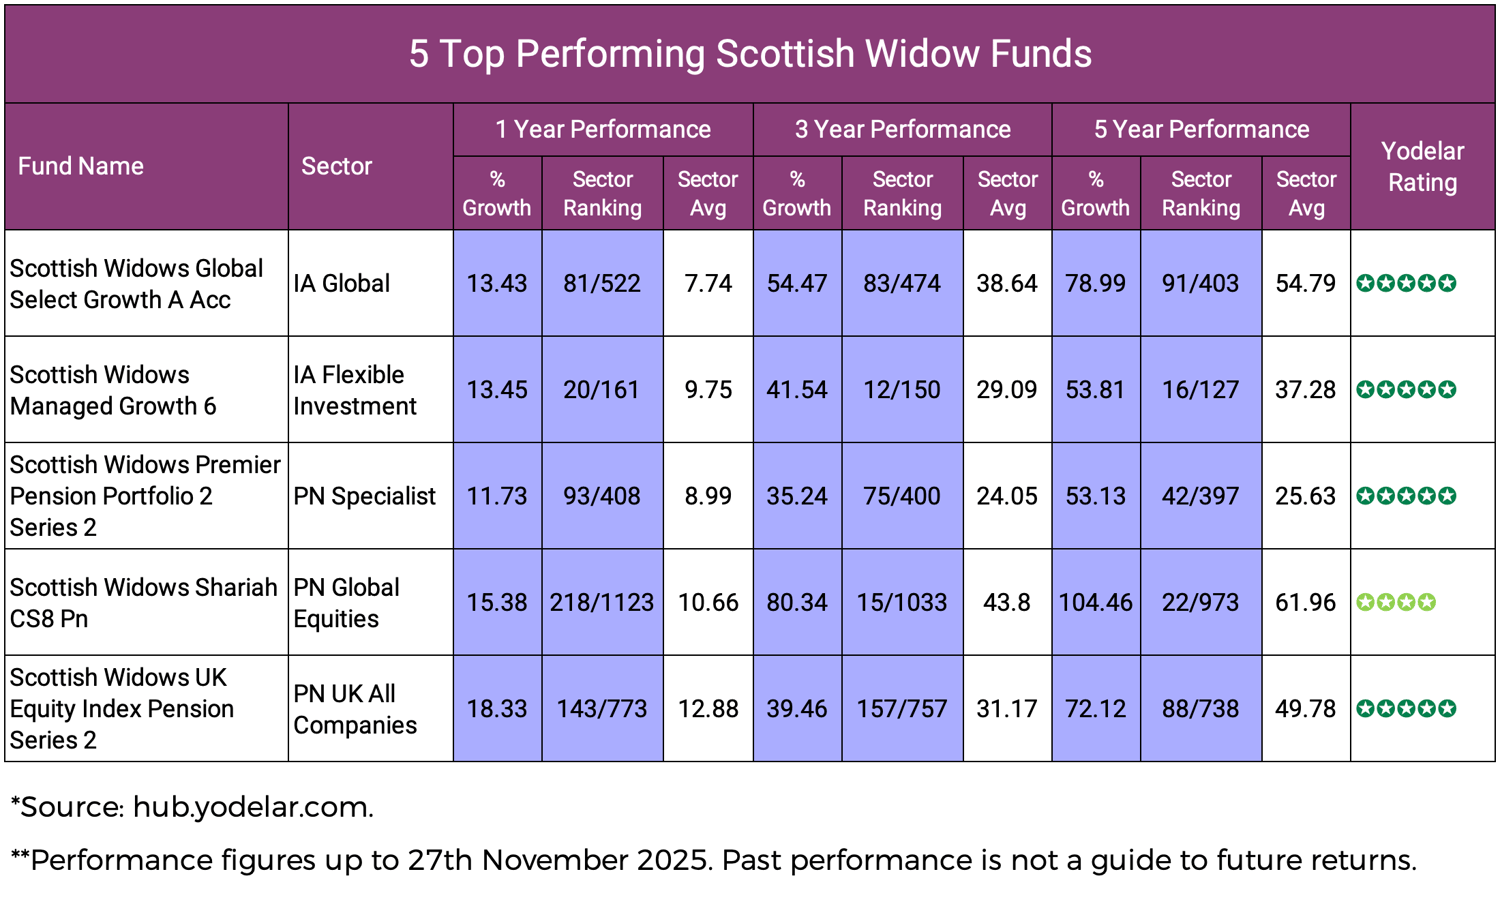
- The 5 strongest funds featured in this article have outperformed their sector peers over each of the 3 periods analysed.
Scottish Widows is a well known UK investment provider with approximately £232 billion of assets under administration and a broad range of pension and investment funds. Despite its strong brand presence, the performance across its fund range varies considerably. Our analysis reviewed 333 Scottish Widows funds over 1 year, 3 year and 5 year periods to assess how they compared with other funds in the same sectors.
The results show a very wide spread of performance. Some funds have delivered competitive long term growth, while many others have consistently returned less than their sector averages across all timeframes. This variation highlights the importance of assessing each fund individually rather than relying on the wider brand.
This report highlights the strongest and weakest funds within the Scottish Widows range and provides clear insight into where performance has been competitive and where it has fallen behind.

Scottish Widows Fund Performance Summary
Across the funds assessed, 117 achieved a 4 or 5 star Yodelar rating, accounting for 35.1% of the total and reflecting stronger performance within their sectors. However, 43% of the range received a 1 or 2 star rating, highlighting a substantial portion of funds that have delivered weaker long term results when compared with their sector averages.
This distribution shows that even fund managers with strong performers can also have funds that deliver much weaker results. It is therefore important to identify which funds have been competitive and which have not, as this distinction can have a meaningful impact on long term portfolio efficiency.
5 of the Best Performing Scottish Widows Funds
The 5 funds featured below represent some of the strongest performers within the Scottish Widows range. Each has delivered higher growth than its sector average across 1 year, 3 year and 5 year periods. These funds have also ranked in the top quartile of their respective sectors throughout all 3 timeframes, reflecting a level of consistency not seen across much of the wider range.
Their consistent results indicate that these strategies have maintained competitive growth through different market conditions. While many funds in the wider Scottish Widows range delivered average or weaker long term returns, these 5 funds have shown a stronger pattern of multi year performance.
Scottish Widows Global Select Growth Fund
The fund returned 13.43% over 1 year while the sector average was 7.74%. Its 3 year return of 54.47% compares with a sector average of 38.64%. Over 5 years the fund delivered 78.99% versus a sector average of 54.79%. Across all periods the fund’s growth was higher than the sector average.
Scottish Widows Managed Growth Fund
The 1 year return of 13.45% was above the sector average of 9.75%. Over 3 years the fund achieved 41.54% compared with a sector average of 29.09%. The 5 year growth of 53.81% was ahead of the sector average of 37.28%. The figures show that the fund has generated higher returns than the sector during each period assessed.
Scottish Widows Premier Pension Portfolio 2 Series 2 Fund
The fund delivered 11.73% over 1 year against a sector average of 8.99%. Over 3 years its return of 35.24% compares with a sector average of 24.05%. Across 5 years the fund returned 53.13% while the sector average was 25.63%. These results show that the fund has produced higher growth than its sector average across all timeframes.
Scottish Widows Shariah CS8 Pension Fund
The fund returned 15.38% over 1 year compared with a sector average of 10.66%. Over 3 years it achieved 80.34% versus a sector average of 43.80%. The 5 year return of 104.46% compares with a sector average of 61.96%. The data shows that the fund’s growth exceeded sector averages across each measured period.
Scottish Widows UK Equity Index Pension Series 2 Fund
Over 1 year the fund returned 18.33% while the sector average was 12.88%. The 3 year return of 39.46% compares with a sector average of 31.17%. Across 5 years the fund achieved 72.12% against a sector average of 49.78%. The results show that the fund tracked the broader UK market with returns above the sector average throughout the analysis period.
5 of the Worst Performing Scottish Widows Funds
The following 5 funds represent some of the weakest performers within the 333 Scottish Widows funds analysed. Each has delivered returns below their sector averages across 1 year, 3 year and 5 year periods, with several ranking in the bottom quartile of their sectors throughout these timeframes.
Their results show that these strategies have delivered slower growth than many comparable funds in the same sectors across multiple periods. While some Scottish Widows funds achieved stronger long term performance, these 5 funds have shown a consistent pattern of lower returns.
Scottish Widows Horizon Multi Asset 1 Fund
Over 1 year the fund returned 5.34% compared with a sector average of 8.76%. The 3 year return was 13.40% versus a sector average of 27.02%. Over 5 years the fund delivered 0.27% against a sector average of 29.60%. These results show that the fund grew at a slower rate than the wider sector across all measured periods.
Scottish Widows Cautious Managed Pension Series 2 Fund
The fund achieved 7.51% over 1 year while the sector average was 11.35%. Its 3 year growth of 16.17% compares with a sector average of 25.53%. Over 5 years the fund returned 21.02% against a sector average of 24.88%. Across all timeframes the fund’s growth was below its sector average.
Scottish Widows UK Opportunities Pension Series 2 Fund
The 1 year return of 4.55% was lower than the sector average of 12.88%. Over 3 years the fund returned 12.83% while the sector average was 31.17%. The 5 year return was 14.37% compared with a sector average of 49.78%. The data shows that growth was consistently lower than the sector across the short, medium and long term.
SW Multi Manager UK Equity Income PN CS8 Fund
The fund returned 8.58% over 1 year, compared with a sector average of 15.14%. Over 3 years the fund delivered 19.49% while the sector average was 35.52%. Across 5 years it achieved 54.10% versus a sector average of 66.60%. The data indicates that the fund has grown at a slower pace than the sector averages across each timeframe.
SW Passive Multi Asset I PN CS3 Fund
The 1 year return of 4.96% compares with a sector average of 6.23%. Over 3 years the fund delivered 8.89% while the sector average was 15.77%. The 5 year return was -8.01% against a sector average of 8.30%. This shows that the fund lagged behind its sector over all periods analysed, particularly over 5 years.

Conclusion
Scottish Widows remains a well established provider in the UK investment and pensions market, offering a wide selection of funds across different asset classes. However, the performance distribution across the range shows considerable variation. Only a smaller portion of the funds delivered consistently strong multi year growth, while a significant number returned less than the averages of their respective sectors over extended periods.
This review highlights the importance of assessing each fund individually. Even when a provider offers some top performing options, it can also have funds that deliver much weaker results. Understanding which funds fall into each category is an essential part of ensuring a portfolio is structured efficiently and aligned with long term objectives.

Assessing the Efficiency of Your Current Portfolio
This review shows how performance can vary widely across a single fund range. Even within a well known provider such as Scottish Widows, some funds have delivered strong multi year growth while others have lagged behind their sectors for long periods. Many investors hold these funds within older pensions or workplace schemes without realising how much their growth potential depends on the specific funds they are invested in.
A Yodelar Portfolio Analysis can highlight whether your own holdings reflect the stronger or weaker trends identified in this report. Each fund is compared with the average return of similar funds in its sector, showing where growth has been competitive and where gaps have developed over time. The analysis can also identify duplicated holdings, concentration issues and any cost inefficiencies that may be affecting overall outcomes.
You can upload your portfolio to yodelar.com to receive a clear breakdown of how each of your funds has performed and how your portfolio compares with models of a similar risk level.


