


- An analysis of almost 4,000 funds identified that 62.1% have a poor 1 or 2 star performance rating.
- Of the poor rated funds 980 have consistently performed worse than at least 50% of their sector peers over each of the past 1, 3 & 5 year periods.
- With £4.46 billion under management, the SJP Global Absolute Return Fund is one of the largest funds in the UK - yet over the past 5 years it bottom of all 153 funds in its sector for performance.
- The highly competitive IA Global sector has averaged 5 year growth of 88.45%. However, the Baillie Gifford Global Discovery fund returned negative growth of -20% over this period - which was the worst of all 389 funds in the sector.
Significant performance disparities exist between the best and worst funds within the same sectors - yet some of the funds that have consistently underperformed remain among the most popular choices in UK investor portfolios. This misalignment between popularity and performance suggests many investors may be unknowingly exposed to sustained underperformance and reduced long-term growth potential.
In this article, we spotlight 10 widely held funds that, despite managing substantial assets, have consistently ranked among the lowest performers in their respective sectors over 1, 3, and 5 years.
To identify these funds, we conducted a detailed analysis of 3,983 funds across all Investment Association sectors. Each fund was assessed on its performance, sector ranking, and independent rating, enabling us to pinpoint those that have persistently lagged behind their peers over multiple timeframes.
While this report features 10 of the most prominent underperformers, the complete list of all 2,473 funds identified as consistent underperformers is available for download below:
Download The Full Underperforming Funds List
62.1% of Funds Have A Poor Performance Rating
Our analysis found that 680 funds achieved a 4 or 5-star rating, reflecting strong and consistent performance. In contrast, 2,473 funds were rated just 1 or 2 stars, indicating persistently poor returns over multiple periods.

How Yodelar Rates Fund Performance
10 Consistently Underperforming Funds
The table below lists 10 of the largest UK-authorised funds that have consistently underperformed relative to their sector peers. Despite managing substantial assets and attracting broad investor ownership, these funds have failed to deliver competitive returns over 1, 3, and 5-year periods.
The table also offers a clear overview of key performance indicators, including fund size, sector classification, ongoing charges, and comparative returns across multiple timeframes.

*Funds are listed in order of fund size
Each fund has received a poor 1-star rating, reflecting its sustained position in the lowest quartile for performance within its sector.
1. SJP Global Absolute Return L Fund
Launched in November 2013, the SJP Global Absolute Return L Acc Fund is one of the largest in its sector, managing over £4.4 billion in assets. It sits within the IA Mixed Investment 20–60% Shares sector and remains a popular holding among UK investors.
However, the fund has consistently underperformed against its peer group. Over the past 12 months, it returned 4.16%, compared to a sector average of 6.72%. Over 3 years, it delivered 6.23% growth versus the sector’s 8.99% average. Its 5-year return stands at 8.78%, ranking it 153rd out of 153 funds in the sector over that period.
The fund also has one of the higher ongoing charges in its sector at 1.70%, which remains a key cost consideration for investors when assessing overall returns.
2. WS Lindsell Train UK Equity Fund
Launched in July 2006, the WS Lindsell Train UK Equity Acc Fund has long been a high-profile option within the IA UK All Companies sector. It manages approximately £2.7 billion in assets, significantly reduced from previous years when it peaked at over £5.9 billion prior to the pandemic. The fund’s objective is to deliver capital growth over the long term, with a strategy aimed at outperforming the FTSE All-Share Total Return Index across rolling five-year periods.
Despite its established reputation and substantial asset base, the fund has underperformed against its sector over multiple timeframes. Over the past year, it returned 3.78%, compared with a sector average of 9.78%. Over 3 years the fund returned growth of 2.30%, which was also well below the sector average of 5.56%. Over five years, it has returned 4.43% compared to the sector average of 13.25%. This prolonged period of relative underperformance has contributed to considerable investor outflows, with around £1.5 billion withdrawn from the fund over the past year alone.
The fund maintains a highly concentrated portfolio, with approximately 87% of assets held in just ten stocks. This lack of diversification has left the fund more exposed to individual stock performance, particularly in cases where key holdings have struggled. Notably, companies such as Diageo, Burberry, and Sage Group have posted weaker results in recent periods, contributing to the fund’s lagging performance.

3. Jupiter European I Fund
The Jupiter European I Acc fund currently manages £2.32 billion in assets and has consistently ranked among the weakest performers in the IA Europe ex UK sector. Over the past 12 months, the fund delivered -3.98%, in stark contrast to the sector’s average gain of 7.81%. The three-year return of 13.59% was less than half the 30.15% sector average, and the five-year performance was similarly lacklustre at 51.24%, compared with a sector average of 99.78%.
Its main goal is to provide long-term capital growth by outperforming the FTSE World Europe ex-UK Index over five years. At least 70% of assets are allocated in shares of companies based in Europe (excluding the UK), with up to 30% allocated to other assets, including global companies, other funds, cash, and near-cash instruments.
Recent underperformance can be attributed to multiple factors. European equity markets have faced headwinds from economic uncertainty, rising inflation, and geopolitical tensions. These broader conditions have affected returns across the region. A change in management in October 2019 introduced new investment strategies and portfolio adjustments. Such transitions can result in inconsistent performance as the new team’s approach takes effect and the portfolio realigns with their long-term view.
One thing that cuts into investors' returns is the fund's relatively high ongoing charge of 0.99%. This is particularly relevant in a market where many lower cost alternatives have performed much better.
4. Vanguard LifeStrategy 20% Equity A Gross Shares Fund
The Vanguard LifeStrategy 20% Equity Fund is the most cautious option in Vanguard’s LifeStrategy range and aims to provide income and capital growth. It has the lowest potential for risk in the range and currently holds a risk category of 3 out of 10. As the name indicates, the fund allocates 20% to equities, with the remaining 80% invested in lower-risk bonds.
Although it manages £1.07 billion in assets and offers one of the lowest ongoing charges at only 0.22%, the fund has consistently struggled compared to its peers. While cost-efficient, its passive, rules-based approach lacks tactical flexibility to adapt to shifting macro conditions.
In the last year, the fund achieved a return of 3.82%, falling short of the sector average of 4.96%. Over three years, it posted a return of -1.42%, compared to the sector average of 5.21%, ranking it 65th out of 68. Its five-year performance was equally disappointing at 8.13%, significantly below the sector average of 22.07%, placing it 56th out of 57 - making it one of the most high profile underperforming funds in the IA Mixed Investment 0–35% Shares sector.
5. Schroder US Mid Cap Fund
The Schroder US Mid Cap Z Acc Fund manages assets of £782.7 million and has consistently been one of the underperforming funds in the IA North America sector.
It aims to deliver capital growth and income exceeding the Russell 2500 Total Return Lagged (Net Total Return) Index over a three to five-year period, after fees. This actively managed fund invests at least 80% of its assets in equity and equity-related securities of medium-sized U.S. companies. These companies are specifically selected from the bottom 40% of the North American equity market by market capitalisation at the time of purchase.
Its recent track record has been underwhelming, marked by consistent struggles across measured timeframes. Over the past 12 months, it returned loss of -2.58%, compared with the sector average of 4.94%. The three-year return stood at 10.09%, which failed to match the sector average of 24.84%. Over five years, the fund delivered 94.26%, a figure that remains well under the sector's return of 107.47%.
The fund’s emphasis on mid-cap U.S. equities increases its exposure to market volatility, as medium-sized firms tend to be more sensitive to economic fluctuations than larger corporations. Its substantial allocation to sectors such as technology and industrials has also introduced greater risk during periods of sector weakness. Although the active management approach targets capital growth, several stock selections have underperformed relative to the broader market. Ongoing economic uncertainty and geopolitical tensions in the U.S. have further affected mid-cap stocks, limiting the fund’s ability to generate robust results.
The ongoing charge of 0.91% places an additional drag on returns, particularly during extended periods of weak performance.

6. Aegon Sustainable Diversified Growth B Fund
The Aegon Sustainable Diversified Growth B Acc fund is a global multi-asset portfolio designed to deliver long-term growth while adhering to strict ESG principles. Its objective is to outperform UK CPI inflation by at least 3% annually over any five years. The fund invests across equities, fixed income, and derivatives, focusing on sustainable companies that address global challenges.
The fund currently manages £741.6 million in assets but has delivered weak returns and ranked among the worst performers in the IA Mixed Investment 40–85% Shares sector. Over the past 12 months, it returned 4.70%, falling below the sector average of 6.25%. Its three-year performance saw a sharp decline of -6.91%, ranking last out of 209 funds in its sector. Over five years, it returned just 24.50%, compared to the sector average of 57.4%, again placing it last among 187 funds.
The potential reasons behind this notable underperformance include the fund’s strict environmental, social, and governance (ESG) criteria. While suitable for ethically minded investors, these criteria have reduced the investment universe by excluding sectors and companies that have delivered strong returns.
Furthermore, its exposure to volatile sectors has exacerbated losses during market downturns. The fund’s ongoing charge of 0.52% is relatively low compared to other active funds, yet it still impacts net performance, particularly when returns are already under strain.
Global economic uncertainty and sustained market volatility have amplified these challenges. Rising interest rates in 2022 and 2023 affected both equities and bonds, creating a difficult environment for diversified multi-asset funds with limited tactical flexibility.
7. abrdn Asia Pacific Equity I Fund
The abrdn Asia Pacific Equity I Acc fund is an actively managed portfolio that seeks long-term capital growth by investing at least 70% in equities from Asia Pacific countries, excluding Japan. It targets companies that are either based in the region or derive a significant proportion of their revenue from it.
The fund currently manages £695.7 million in client assets, yet over the past 12 months, it delivered a return of just 5.29%, well below the sector average of 8.94%. The long-term picture is more concerning, with a 3-year return of -4.49% compared to the 6.64% sector average. Its 5-year return of 27.60% also lagged significantly behind the sector average of 49.45%.
One of the key drivers of the fund’s poor performance has been its heavy exposure to Chinese equities, which have remained volatile and underperformed relative to other parts of Asia. The lack of regional diversification has adversely affected results compared to peers with broader allocations. As an emerging markets fund, it is also exposed to elevated political, economic, and currency risks, which can increase return variability.
The fund’s overweight position in China proved particularly damaging as the market faced a triple shock—regulatory crackdowns on tech and education firms, a severe property sector crisis, and a slower-than-expected post-pandemic recovery. These combined headwinds have exerted sustained downward pressure on returns.
An ongoing charge of 0.86% impacts net performance, leading to the fund's low ranking within the IA Asia Pacific ex-Japan sector.
8. Stewart Investors Global Emerging Markets All Cap B Fund
The Stewart Investors Global Emerging Markets All Cap Fund manages £579.4 million in assets and has consistently ranked in the bottom quartile of its sector.
Over the past 12 months, this fund posted a negative return of -5.35%, ranking 165th out of 165 in its sector. The difficulties faced by this fund are not limited to the past year alone. Over the past 3 & 5 years the fund returned just 0.03% and 25.27% respectively, both well below the sector averages of 10.07% and 49.17%. This prolonged underperformance indicates weaknesses in the fund’s positioning and execution relative to peers.
The fund aims for long-term capital growth (over at least five years). It invests in high-quality companies based in emerging markets or with most of their operations there, including those listed on stock exchanges worldwide. Using a bottom-up selection process, it focuses on firms with strong management, solid financials, and a commitment to sustainable development.
Its performance has been hindered by both structural and external factors. Emerging markets are developing countries with growing financial systems and regulatory structures. These markets are more susceptible to economic and political instability than developed economies. As a result, the fund faces heightened risks, including currency volatility, liquidity constraints, capital transfer restrictions, delayed settlements, and valuation difficulties.
The fund’s strategy has been penalised under recent global conditions. Commodity price volatility, China’s economic slowdown, and geopolitical tensions have negatively impacted sustainability-focused portfolios. A relatively high ongoing charge of 0.92% and recent management changes may have further contributed to short-term performance disruption.
9. Baillie Gifford Global Discovery B Fund
The primary objective of the Baillie Gifford Global Discovery Fund is to outperform the S&P Global Small Cap Index (in sterling terms) by 2% per year over rolling 5-year periods, after fees.
The fund adopts a high-conviction, bottom-up approach, investing in innovative and immature companies with the potential to become future market leaders. These are typically smaller businesses with capitalisations similar to or below the largest constituents of the benchmark index.
With £343.8 million in client assets under management, the fund’s strategy has resulted in sustained underperformance within the IA Global sector. Over the past year, it returned a loss of -7.30%, while the sector average was 3.88%. Its three-year return of -39.41% was the lowest in the sector, and over five years, the fund returned -20.00%, ranking last among 389 funds in its peer group.
The impact of rising interest rates and sector volatility has been evident in the fund’s declining performance. Its concentration in high-growth sectors including technology, biotechnology, healthcare, and communication services has increased sensitivity to inflation, higher borrowing costs, and reduced investor risk appetite.
Inflationary pressures and geopolitical tensions have also created unfavourable conditions for the fund’s target market, weighing on overall returns. In addition, its strategic focus on early-stage, disruptive companies may intensify its risk profile.
10. T. Rowe Price Global Technology Equity Fund
The T. Rowe Price Global Technology Equity Fund manages assets worth £241.2 million. It is designed to grow the value of its shares by investing in a diversified portfolio of companies engaged in technology development or application. This actively managed portfolio includes leading global technology firms across both developed and emerging markets.
Recent performance has been below expectations. Over the past 1, 3, and 5 years, the fund delivered returns of 3.13%, 25.13%, and 65.57% respectively. These results are well below the sector averages of 4.31%, 28.49%, and 119.24%, placing the fund among the weaker performers in the IA Technology and Technology Innovation sector.
A significant managerial transition in late 2022 led to a shift in investment strategy, which may have disrupted existing portfolio processes. Its high allocation to technology companies has left it exposed to sector-specific fluctuations. In addition poor stock selection in software and internet companies was a major factor behind recent underperformance. The fund also carries a high ongoing charge of 0.83%, which impacts net returns.
Long-Term Success Depends on Quality, Not Popularity or Size
Investor behaviour is often influenced by perception rather than performance. A recurring error is the assumption that the most popular or heavily marketed funds are also the most effective. In reality, strong brand recognition, media presence, and high inflows are not reliable indicators of investment quality or future returns. Being popular doesn't guarantee good performance, and the size of a fund doesn't necessarily indicate its strength.
This analysis highlights a stark disconnect between investor expectations and fund outcomes. Among the UK’s most prominent and widely held funds, several have consistently delivered poor results, ranking in the lower quartiles of their sectors over 1, 3, and 5-year periods. Despite their scale, these funds have failed to deliver competitive returns, exposing flaws in the common selection criteria used by many retail investors.
Performance consistency and fund manager discipline remain far more reliable indicators of success. Top-quartile performers tend to exhibit strong governance, effective investment strategies, and a proven ability to navigate varying market conditions. In contrast, large funds that repeatedly underperform offer little justification for continued inclusion in long-term portfolios.
The evidence supports a fundamental principle: sustained investment success is grounded in quality. Selecting funds based on brand familiarity or popularity, without a clear evaluation of past performance and risk-adjusted returns, increases the likelihood of long-term underperformance. Investors must remain focused on measurable outcomes and rigorous analysis, not reputation. In this context, size and status are poor substitutes for substance.

The Importance of Assessing Fund Performance
Evaluating fund performance is a key consideration for both investors and advisory firms. While past returns cannot guarantee future outcomes, a consistent track record is often seen as a sign of strong manager competence.
Comparative Benchmarking
A fund’s results should be measured against others in the same sector. This allows for a fair comparison and highlights relative strengths or weaknesses. Reviewing performance over multiple timeframes reveals patterns that short-term data may overlook.
Managerial Effectiveness
Historical returns provide insight into the abilities of a fund’s management team. Funds that regularly appear in the top quartile tend to show strong oversight and sound judgement. In contrast, those that rank consistently low suggest weak strategy or poor execution. While past returns do not predict the future, they help identify management quality.
Resilience Across Market Cycles
Effective funds demonstrate the ability to manage through varying economic and political conditions. Long-term performance across multiple market cycles offers a clearer picture of a fund manager’s adaptability and strategic competence.
Make Smarter Investment Decisions with Yodelar
This analysis reveals a concerning truth - many of the UK’s most prominent funds are not delivering competitive returns for investors. Despite managing billions in assets and enjoying widespread popularity, a substantial number of these funds have consistently ranked among the worst in their sectors across 1, 3, and 5 year periods. With 62.1% of funds receiving poor performance ratings, the data underscores the importance of objective fund analysis over brand perception or reputation.
For investors, the consequences of holding underperforming funds can be significant -reduced growth potential and slower progress toward long-term financial goals. Yet, this underperformance is not always obvious without detailed benchmarking and comparative sector analysis.
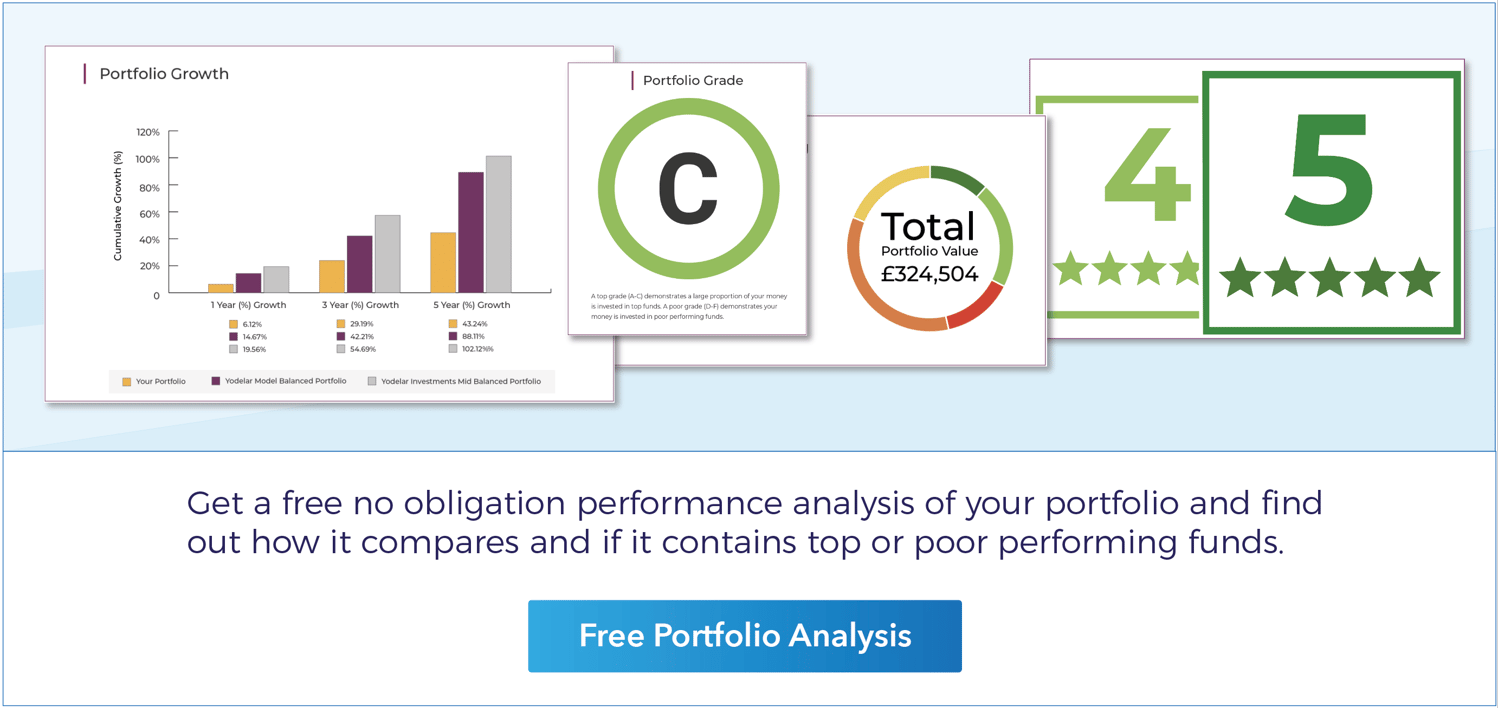
We believe every investor deserves access to data-driven insights and high-quality portfolio management. Our comprehensive fund reviews and evidence-based investment approach are designed to ensure your portfolio is aligned with the best available opportunities, not just the most familiar names.
If you're concerned that your current investments may be underperforming, or if you simply want a more transparent and strategic approach to growing your wealth, we invite you to book a free, no-obligation call with one of our expert advisers. We’ll assess the quality of your existing holdings and show you how our research-led strategies can deliver more consistent long-term results.
Book A No Obligation Call With A Yodelar Investments Adviser


