


-
We reviewed 253 BlackRock, Fidelity and Vanguard funds with performance data to 30 June 2026.
-
Vanguard had the strongest Yodelar Rating profile, with 26.6% of funds rated 4 or 5 stars.
-
BlackRock had the highest average returns across the 1, 3 and 5-year periods reviewed, although broad averages are affected by sector mix and should not be treated as a complete provider comparison.
-
Fidelity had the weakest rating distribution, with only 9.8% of funds rated 4 or 5 stars and 62.2% rated 1 or 2 stars.
-
Across all three groups, only 17.4% of funds achieved a 4 or 5 star Yodelar Rating, showing why investors should assess funds individually rather than relying on provider reputation.
BlackRock, Fidelity and Vanguard are three of the best-known fund groups available to UK investors. Their funds appear regularly in ISAs, SIPPs, workplace pensions and self-invested portfolios.
That familiarity can create confidence, but it can also create a blind spot. A strong fund group does not mean every fund in its range has performed strongly.
The latest Yodelar analysis shows why investors should avoid choosing funds based on name recognition alone. Across the 253 BlackRock, Fidelity and Vanguard funds reviewed, performance varied significantly by fund, sector and time period.
There was no single fund group that dominated across every measure. BlackRock produced the highest average returns across the 1, 3 and 5-year periods reviewed, but Vanguard had the strongest Yodelar Rating profile and the lowest average ongoing charges figure. Fidelity had the weakest overall rating distribution, with the lowest proportion of 4 and 5 star rated funds and the highest proportion of 1 and 2 star rated funds.

How We Compared The Funds
This analysis reviewed BlackRock, Fidelity and Vanguard funds using performance data to 30 June 2026. Each fund was assessed using available 1, 3 and 5-year performance figures, sector ranking, ongoing charges figure and Yodelar Rating.
The Yodelar Rating is based on historic fund performance compared with funds in the same Investment Association sector. It is designed to show how a fund has performed relative to comparable funds, rather than judging it only by its headline return.
A 4 or 5 star Yodelar Rating indicates a stronger historic performance profile compared with sector peers. A 3 star rating reflects a more mixed or average historic performance profile. A 1 or 2 star rating indicates weaker historic sector-relative performance.
This distinction matters. A fund can deliver a positive return and still perform poorly compared with similar funds. Equally, a fund may look disappointing in isolation but still rank well in a difficult sector. Sector ranking gives performance the context investors need.
BlackRock Fidelity And Vanguard Compared
The table below summarises the latest data across the three fund groups.
|
Fund group |
Funds analysed |
Average 1-year return |
Average 3-year return |
Average 5-year return |
Average OCF |
Funds rated 4 or 5 stars |
Funds rated 1 or 2 stars |
|---|---|---|---|---|---|---|---|
|
BlackRock |
77 |
19.82% |
41.76% |
39.75% |
0.51% |
14.3% |
57.1% |
|
Fidelity |
82 |
19.20% |
40.32% |
33.94% |
0.62% |
9.8% |
62.2% |
|
Vanguard |
94 |
17.77% |
40.20% |
37.74% |
0.20% |
26.6% |
48.9% |
A simple reading of the table could suggest that BlackRock led on average returns, while Vanguard led on ratings and cost. However, investors should be careful with broad provider-level averages.
Each fund group has a different mix of sectors, strategies and risk levels. A fund group with more exposure to strongly performing sectors may show higher average returns, even if not all individual funds have ranked well against their peers. That is why the Yodelar Rating profile is useful. It looks beyond the headline return and considers how funds compared within their own sectors.
On this basis, Vanguard had the strongest overall rating profile. It had the highest proportion of 4 and 5 star rated funds and the lowest average OCF. However, almost half of Vanguard funds reviewed were still rated 1 or 2 stars, so low cost and a strong brand do not remove the need for fund-by-fund analysis.
BlackRock delivered the highest average returns across the periods reviewed, but only 14.3% of its funds were rated 4 or 5 stars. Fidelity had the highest average OCF and the weakest rating distribution.
The data does not support a simple conclusion that one provider is always better. It shows that the fund selected matters more than the brand name.
Vanguard Had The Highest Proportion Of 4 And 5 Star Funds
Vanguard is often associated with low-cost index investing, and the data supports its cost advantage. Across the 94 Vanguard funds reviewed, the average OCF was 0.20%, compared with 0.51% for BlackRock and 0.62% for Fidelity.
Vanguard also had the highest proportion of stronger-rated funds. 26.6% of Vanguard funds were rated 4 or 5 stars, compared with 14.3% for BlackRock and 9.8% for Fidelity.
This is a positive finding for Vanguard, but it should not be overread. The same data also shows that 48.9% of Vanguard funds were rated 1 or 2 stars. This means investors should not assume that every Vanguard fund is strong simply because the provider is known for low costs and broad market exposure.
Vanguard’s results highlight a broader point. Low costs can help, but they do not guarantee that a fund will be suitable or that it will outperform sector peers. Investors still need to understand what the fund holds, how it has ranked, what risk it carries and how it fits within the wider portfolio.

BlackRock Recorded The Highest Average Returns
BlackRock had the highest average returns across the periods reviewed. Its average 1-year return was 19.82%, average 3-year return was 41.76%, and average 5-year return was 39.75%.
BlackRock accounted for three of the five highest 5-year returns in the dataset. The highest 5-year return came from BlackRock Gold & General D Acc, followed by BlackRock BGF World Energy D4 GBP and BlackRock US Dynamic D Acc.
However, these figures need context. Some of the strongest BlackRock returns came from more specialist areas, including gold, energy and US equities. These sectors can produce strong returns over certain periods, but they can also carry higher levels of volatility and may not be suitable for every investor.
The Yodelar Rating profile also shows a more balanced picture. Only 14.3% of BlackRock funds were rated 4 or 5 stars, while 57.1% were rated 1 or 2 stars.
The point is not that BlackRock funds performed poorly. The point is that strong headline returns in parts of the range should not be mistaken for strength across the whole fund group.
Fidelity Had The Lowest Proportion Of 4 And 5 Star Funds
Fidelity had the lowest proportion of 4 and 5 star rated funds and the highest proportion of 1 and 2 star rated funds in the dataset. Of the 82 Fidelity funds analysed, only 9.8% were rated 4 or 5 stars, while 62.2% were rated 1 or 2 stars.
This does not mean Fidelity has no strong funds. The dataset included several stronger Fidelity performers, including Fidelity Japan W Acc, Fidelity Index US P and Fidelity US Equity Research Enhanced UCITS ETF.
However, the overall distribution shows that a large proportion of Fidelity funds reviewed sat in the weaker Yodelar Rating bands. For investors who hold Fidelity funds, this does not mean those holdings are automatically unsuitable, but it does mean they should be reviewed against sector peers rather than held on brand recognition alone.
A familiar provider name can make investors feel more comfortable, but comfort is not the same as evidence. If a fund has ranked poorly over several periods, investors should understand why it is still held and whether it continues to support the portfolio’s objectives.

Highest 5-Year Performers
The table below shows the five strongest 5-year performers across the BlackRock, Fidelity and Vanguard funds reviewed. These are not recommendations. They are included to show the upper range of returns within the dataset.
|
Fund |
Provider |
Sector |
5-year return |
5-year sector rank |
Yodelar Rating |
|---|---|---|---|---|---|
|
BlackRock Gold & General D Acc |
BlackRock |
IA Specialist |
150.46% |
20 of 199 |
4 stars |
|
BlackRock BGF World Energy D4 GBP |
BlackRock |
IA Commodity / Natural Resources |
124.65% |
5 of 25 |
3 stars |
|
BlackRock US Dynamic D Acc |
BlackRock |
IA North America |
109.42% |
10 of 212 |
4 stars |
|
Vanguard US Opportunities Investor USD |
Vanguard |
IA North America |
101.22% |
17 of 212 |
5 stars |
|
Fidelity Japan W Acc |
Fidelity |
IA Japan |
99.96% |
7 of 86 |
4 stars |
This table shows why performance figures need to be read carefully. The strongest 5-year return was not automatically attached to a 5-star rating. Yodelar Ratings consider more than one period and take sector-relative consistency into account.
It also shows the importance of sector context. A specialist gold fund, an energy fund, a US equity fund and a Japan fund can all deliver strong returns, but they may play very different roles in a portfolio and carry different risks.
Investors should not select funds simply because they appear near the top of a performance table. The fund still needs to be suitable for the investor’s objectives, time horizon and attitude to risk.
Lowest 5-Year Returns
The lowest 5-year performers in the dataset also provide useful context. Several of these funds came from bond or China-focused sectors, which have faced difficult conditions over the period reviewed. However, weak returns and weak sector rankings should still prompt closer review.
|
Fund |
Provider |
Sector |
5-year return |
5-year sector rank |
Yodelar Rating |
|---|---|---|---|---|---|
|
Vanguard UK Long Duration Gilt Index A Gross Acc GBP |
Vanguard |
IA UK Gilts |
-42.88% |
26 of 27 |
1 star |
|
Fidelity Index Linked Bond I Inc |
Fidelity |
IA UK Index Linked Gilts |
-42.79% |
12 of 12 |
1 star |
|
Vanguard Japan Government Bond Index Institutional Acc JPY |
Vanguard |
IA Specialist Bond |
-42.77% |
75 of 76 |
1 star |
|
Fidelity China W Acc |
Fidelity |
IA China / Greater China |
-41.91% |
53 of 54 |
1 star |
|
BlackRock Institutional Bond Index Linked A |
BlackRock |
IA UK Index Linked Gilts |
-39.84% |
10 of 12 |
2 stars |
These figures do not mean the funds listed are automatically unsuitable for every investor. A bond fund, for example, may have been held for a particular risk or portfolio purpose. A China-focused fund may have been held for specialist exposure.
However, investors should not ignore sustained weak performance. If a fund has delivered poor returns and ranked near the bottom of its sector, the reason for holding it should be clear and current.
This is why provider name alone should not be used as the basis for fund selection.
Why Provider Names Are Not Enough
The most important lesson from this analysis is that fund group reputation can hide large differences between individual funds.
A provider can have several sector-leading funds while also running funds that rank poorly. A low-cost fund group can still have weak performers. A higher-cost fund group can still have strong funds. A provider with impressive headline returns can still have a large proportion of 1 and 2 star rated funds.
This is why provider name alone should not be used as the basis for fund selection.
Many investors hold funds from BlackRock, Fidelity or Vanguard because the names are familiar and widely used. Familiarity can be useful when it reflects scale, access and experience, but it should not replace performance analysis.
The investor does not own the fund group. They own specific funds. Those funds should be judged on their own results, sector ranking, charges and role within the portfolio.

What To Check If You Use One Provider
Some investors build most of their portfolio with one fund group because it feels simpler. They may hold several Vanguard funds, several Fidelity funds or several BlackRock funds and assume that because the provider is large and reputable, the portfolio is well built.
That may not be the case.
A portfolio built around one provider can still be duplicated, concentrated or exposed to weaker funds. It may also miss stronger options available from other fund groups in the same sectors.
This does not mean investors must avoid holding several funds from one provider. It means they should understand whether each fund has earned its place.
A stronger approach is to select funds on evidence, not brand familiarity. That means looking at how each fund has performed compared with similar funds, whether charges are justified, whether the fund duplicates other holdings, and whether it contributes something useful to the portfolio.

What Investors Should Review
Investors who hold BlackRock, Fidelity or Vanguard funds should not start by asking which provider is best. They should start by reviewing the actual funds they hold.
|
Review question |
Why it matters |
|---|---|
|
How has each fund performed over 1, 3 and 5 years? |
This shows the fund’s historic return pattern. |
|
Where does each fund rank in its IA sector? |
This shows whether performance has been strong or weak compared with similar funds. |
|
What is the Yodelar Rating? |
This provides a summary of historic sector-relative performance. |
|
What are the ongoing charges? |
Costs are deducted whether the fund performs well or poorly. |
|
Does the fund overlap with other holdings? |
Several funds may hold similar companies, sectors or regions. |
|
Does the fund still have a clear role? |
Every fund should support the investor’s wider objective and risk profile. |
This type of review does not mean every weaker-rated fund should be sold. There may be reasons for holding a specific fund, including risk control, income needs, tax position or specialist exposure.
However, investors should know which funds are strong, which are weak and which may no longer justify their place.
Check Your Funds With A Free Portfolio Analysis
Many investors hold funds from BlackRock, Fidelity or Vanguard without knowing how those funds rank against their sector peers.
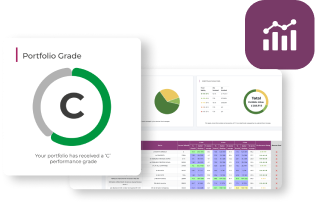
Our free portfolio analysis reviews each fund individually, showing 1, 3 and 5-year performance, sector ranking and Yodelar Rating, where data is available. It can also help identify weaker-rated holdings, duplication, concentration, higher charges and funds that may no longer have a clear role.
Where appropriate, the analysis can also compare backdated portfolio performance with a similar-risk MKC Invest model. This does not provide personal advice and does not recommend whether to buy, sell or switch any investment. It is designed to help investors understand whether further review may be useful.
For investors who hold funds from well-known providers, the analysis can help answer a simple question: are those funds still earning their place in the portfolio?

Speak To An Adviser
For investors who want to understand whether their current portfolio remains suitable, a no obligation call can help.
The discussion can cover the investor’s current holdings, portfolio analysis results, long-term objectives, time horizon and attitude to risk. It can also explain how a more structured investment approach may compare with the portfolio currently held.
Any personal recommendation would only be made after understanding the investor’s financial position, investment objectives, time horizon and attitude to risk. Any recommendation would include a clear explanation of risks, costs and ongoing service.

Summary
BlackRock, Fidelity and Vanguard are among the most recognised fund groups available to UK investors, but the latest data shows that brand recognition is not enough.
BlackRock delivered the highest average returns across the 1, 3 and 5-year periods reviewed, but 57.1% of its funds were still rated 1 or 2 stars. Vanguard had the strongest Yodelar Rating profile and the lowest average OCF, but 48.9% of its funds were also rated 1 or 2 stars. Fidelity had the weakest rating distribution, with 62.2% of funds rated 1 or 2 stars.
The conclusion is not that investors should choose one provider and avoid the others. It is that each fund needs to be judged on its own evidence.
A fund from a trusted provider can still underperform. A low-cost fund can still be unsuitable. A high-returning fund can still carry more risk than an investor expects. The brand name should never be the final reason for holding a fund.
For investors, the practical step is to review the funds they actually own. That means looking at performance, sector ranking, Yodelar Rating, charges, risk and portfolio role.
Before relying on BlackRock, Fidelity, Vanguard or any other provider, investors should first check whether each fund is genuinely supporting their portfolio.
Source and Methodology
-
Source: Yodelar analysis of 253 BlackRock, Fidelity and Vanguard funds using fund performance data to 30 June 2026.
-
The analysis included 77 BlackRock funds, 82 Fidelity funds and 94 Vanguard funds. Average 1-year returns are based on all 253 funds. Average 3-year returns are based on funds with available 3-year data, and average 5-year returns are based on funds with available 5-year data.
-
Yodelar Ratings are based on historic fund performance relative to funds in the same Investment Association sector. Figures are rounded. Past performance is not a reliable guide to future returns.