


- Technology and innovation sectors continued to deliver some of the strongest returns, driven by long-standing global growth trends rather than short-term movements.
- Calendar-year data reveals how volatile conditions have been, with 49 out of 55 sectors experiencing negative returns in 2022 before many rebounded strongly in 2023 and 2024.
- Emerging markets displayed positive performance across both equity and bond sectors, with consistent gains visible across all five periods analysed.
- Natural resources and commodity strategies remained among the strongest long-term performers.
The past year has produced one of the widest spreads of sector outcomes seen in recent periods, shaped by shifting interest rates, uneven global growth and changes in investor sentiment across regions and asset classes. To provide a clear view of how different parts of the market have behaved, we reviewed the performance of all 55 Investment Association sectors across five timeframes. Assessing returns over 3 month, 6 month, 1 year, 3 year and 5 year periods offers useful context on the patterns that may influence how efficiently investor portfolios are positioned as they move into 2026.
This article highlights sectors that have delivered sustained multi year growth, areas showing signs of renewed momentum and those that may be encountering longer running challenges. These insights help investors make sense of the dynamics that have shaped recent market behaviour and how these trends could inform decisions in the year ahead.
Sector Performance at a Glance
The sector performance table illustrates the wide range of outcomes recorded across the 55 Investment Association sectors. Technology, Europe, Latin America and Commodities delivered some of the strongest multi-year results, while sectors such as UK Gilts, Index Linked Gilts and China showed weaker or more inconsistent longer-term outcomes.
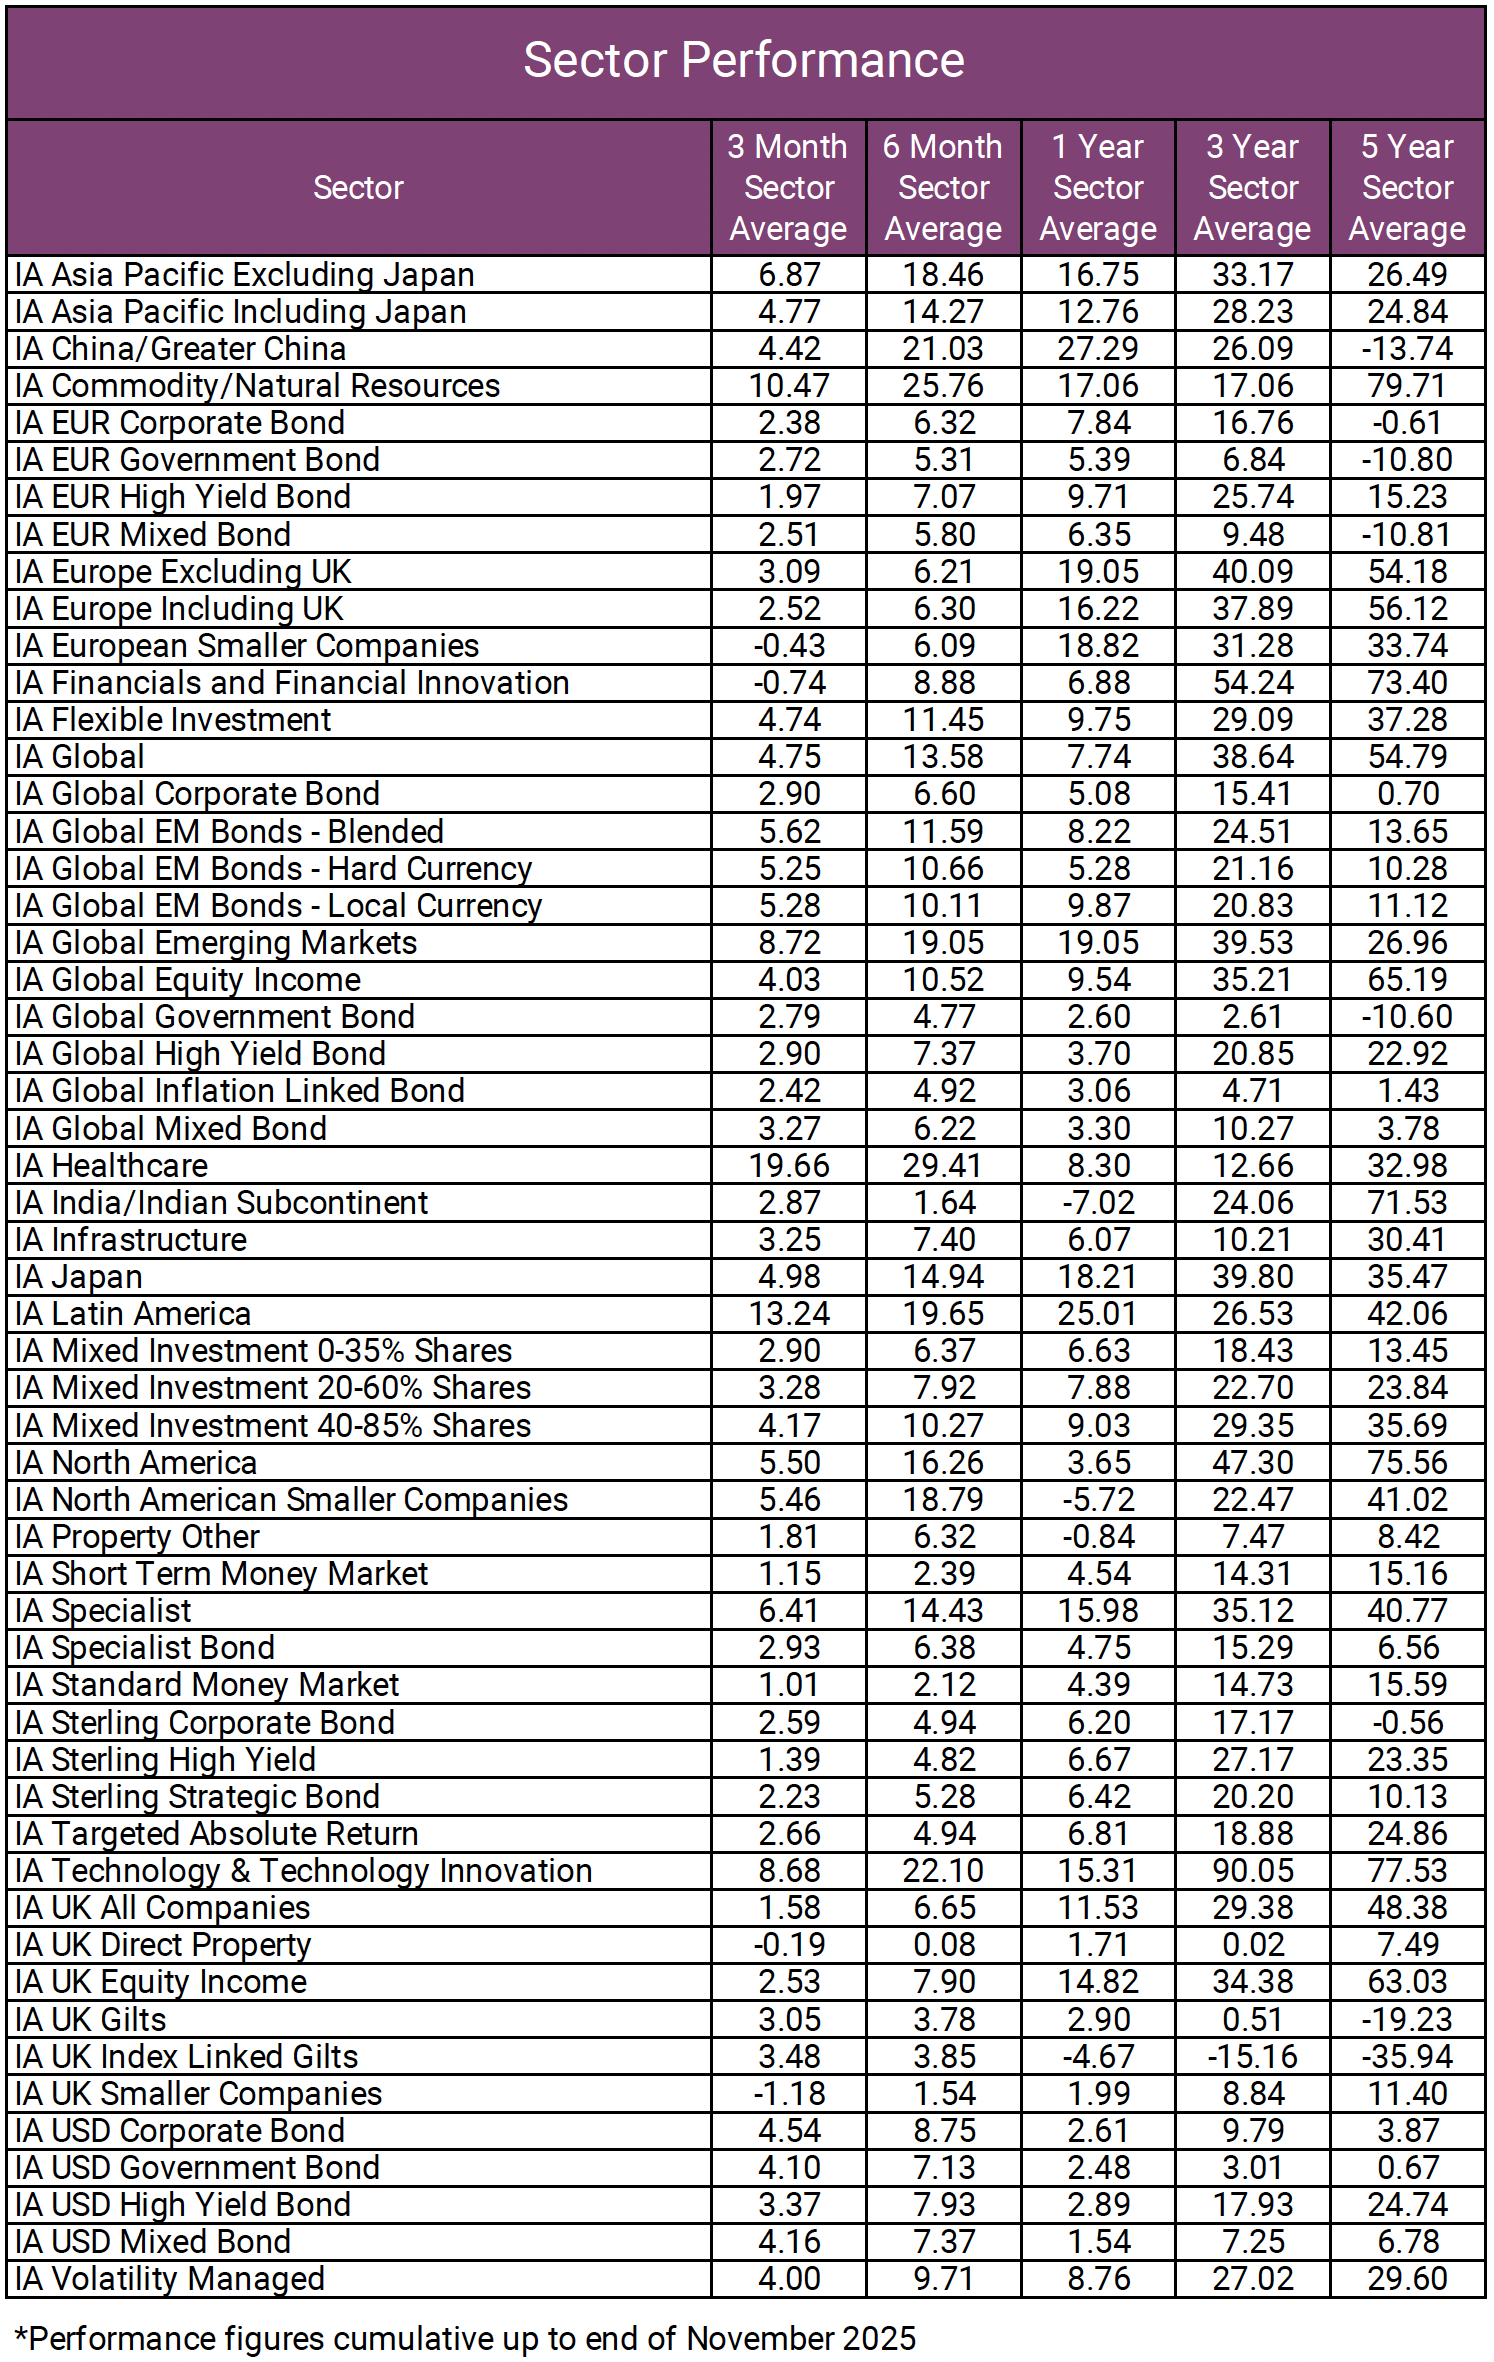
The breadth of this dispersion reinforces the importance of understanding how individual funds compare with their sector averages. As market conditions vary significantly across regions and asset classes, this context helps investors recognise where strengths and weaknesses may sit within their existing portfolio.
Understanding Calendar Sector Performance
While cumulative sector performance shows how each sector has behaved over recent periods as a whole, the calendar sector performance table breaks this down into individual years. This makes it easier to see whether multi-year results have been driven by consistent annual progress or by a small number of unusually strong or weak years.
Technology and North America, for example, show repeated years of positive returns, which helps explain their strong cumulative outcomes despite periods of volatility. By contrast, sectors such as China, UK Gilts and Index Linked Gilts display more frequent negative annual results, aligning with the weaker longer-term figures in the rolling performance table.
Viewed together, cumulative performance highlights the overall trend, while calendar-year results reveal the path taken to achieve it - showing whether growth has been stable, uneven or highly sensitive to market conditions. This broader perspective supports clearer analysis of sector behaviour as investors prepare for 2026.
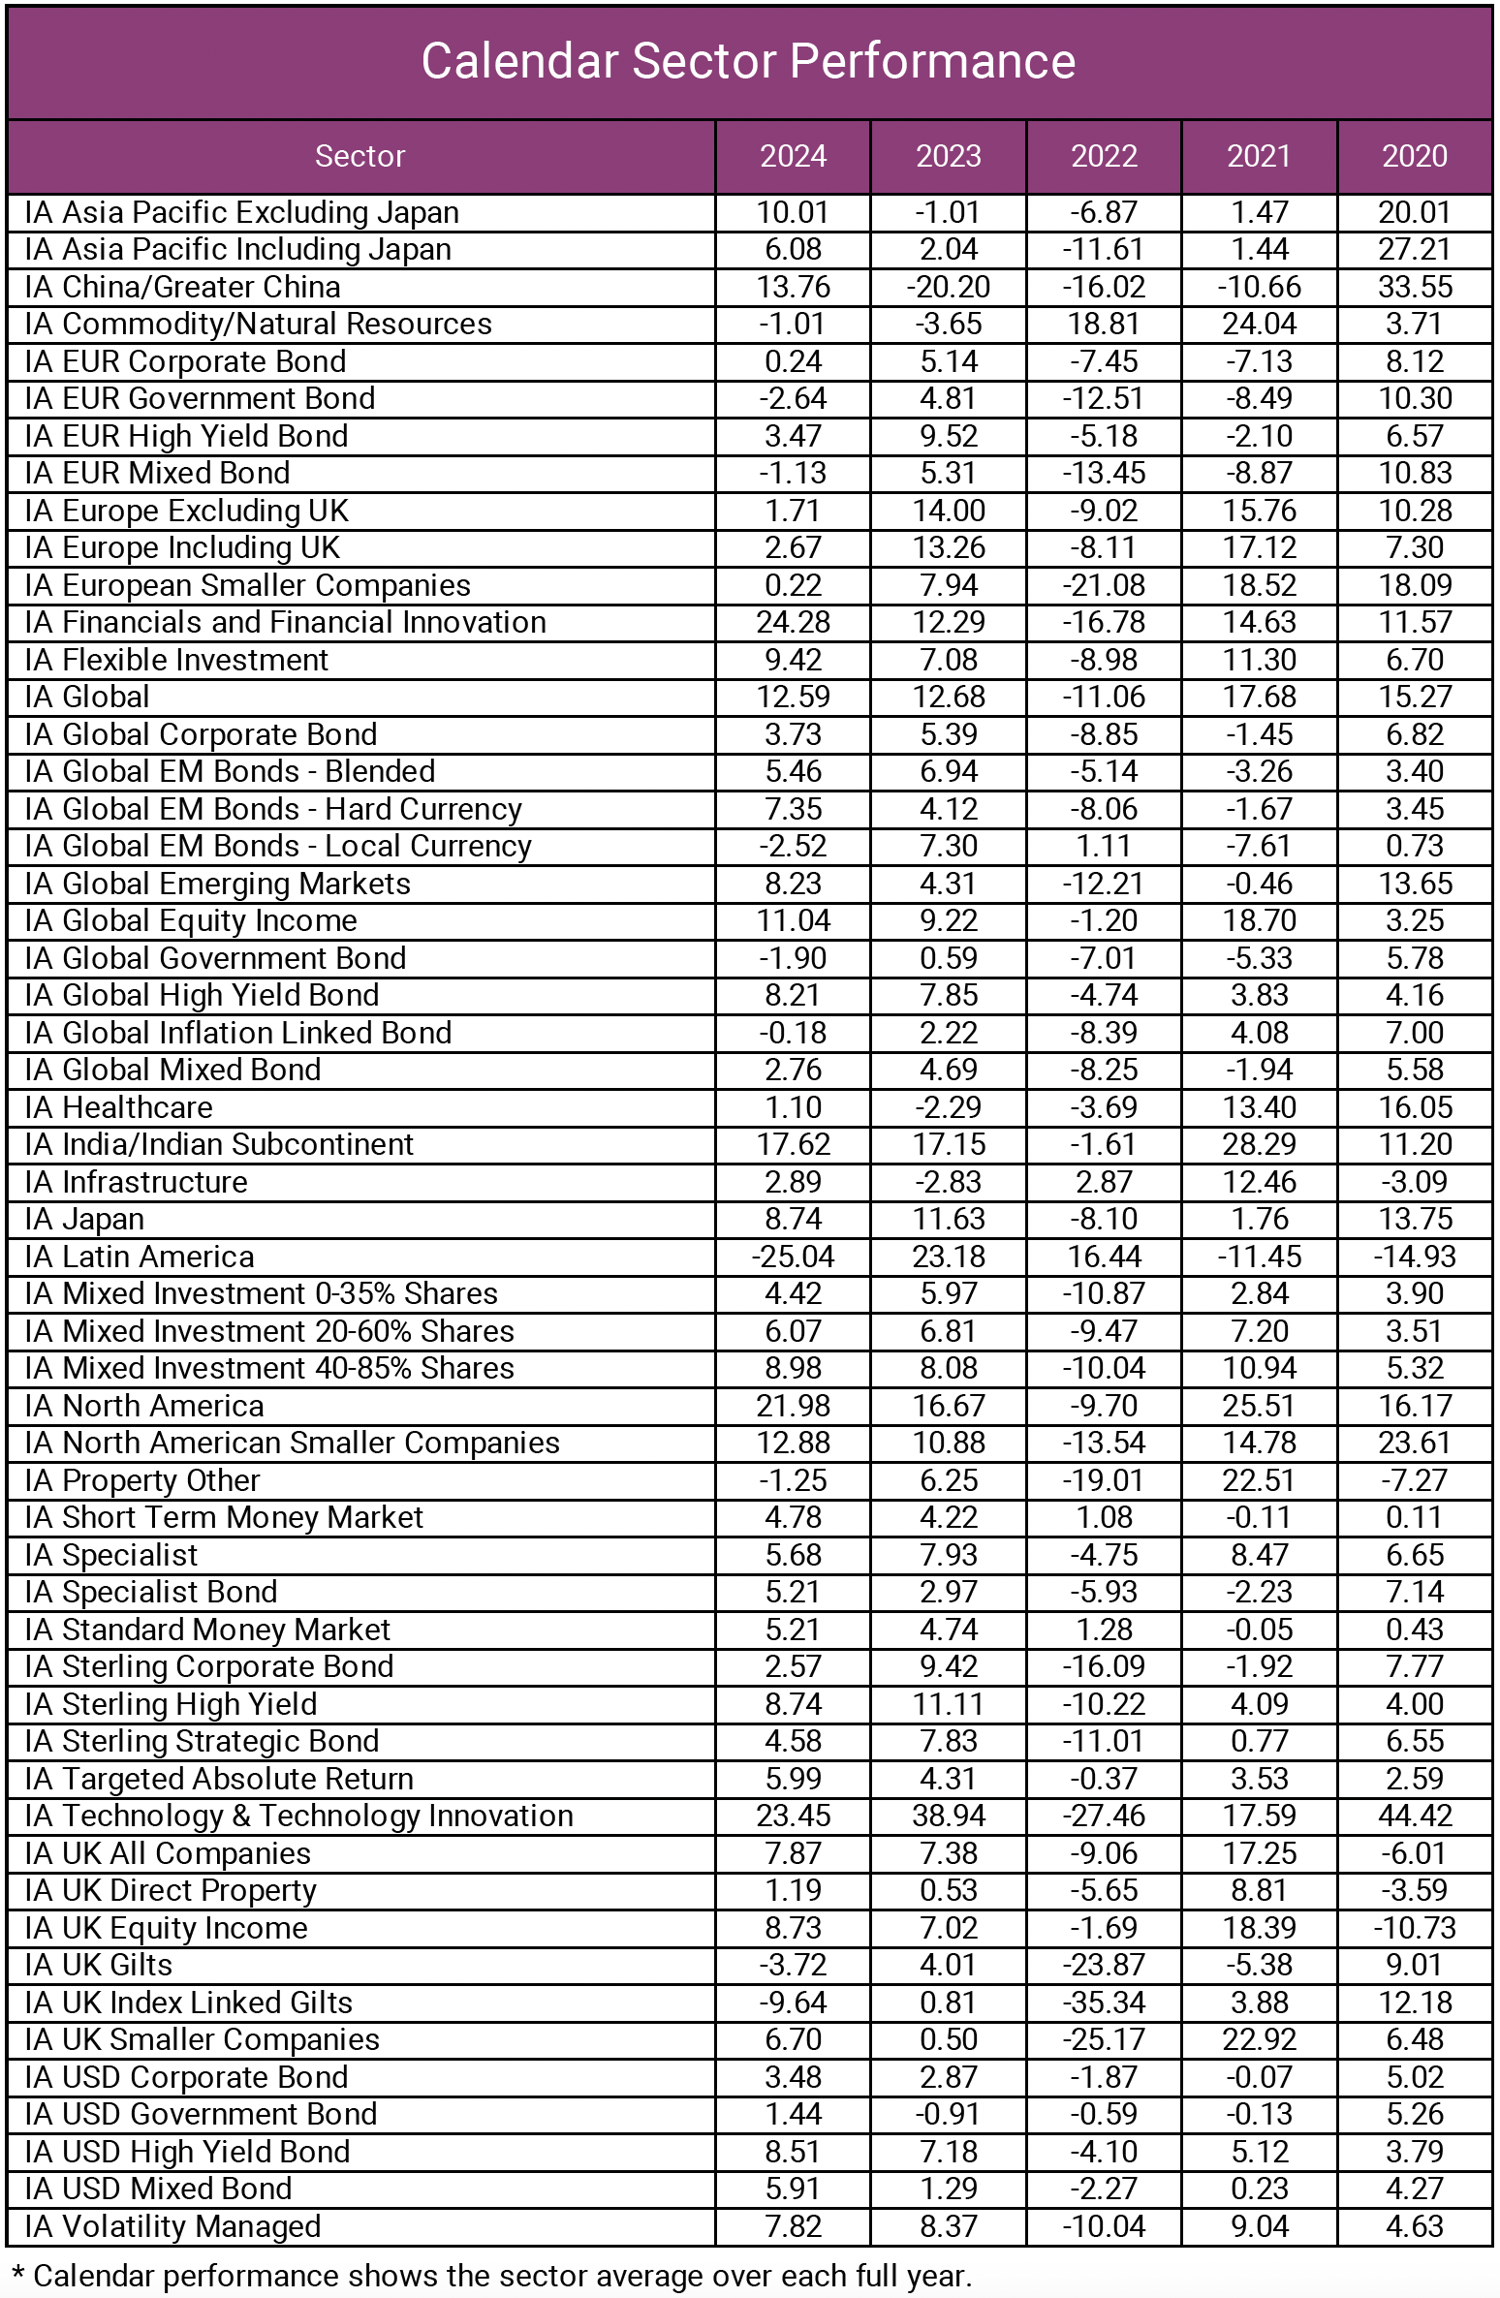
Understanding Market Cycles Through Calendar Performance
The calendar performance table shows that 49 of the 55 sectors delivered negative returns in 2022. Rising interest rates, high inflation and the economic shock triggered by the Ukraine conflict placed downward pressure on both equities and bonds at the same time, creating one of the most challenging investment years in recent memory. However, the results from 2023 and 2024 demonstrate that many sectors not only recovered those losses but went on to deliver further gains. This reinforces the importance of remaining invested through varying market conditions, as periods of decline are often followed by strong rebounds that can be missed when attempting to time the market.

Technology and Innovation Remain Among the Strongest Sectors
Technology-linked strategies again stand out for their sustained strength across multiple periods. The IA Technology and Technology Innovation sector returned 8.68% over three months and 22.10% over six months, contributing to exceptional longer-term results of 90.05% over three years and 77.53% over five years.
Calendar performance shows that multiple strong years, notably 2020, 2021, 2023 and 2024. While 2022 delivered a sharp decline, sustained growth in the surrounding years demonstrates why technology continues to dominate long-term performance tables.
Healthcare Has Delivered Steady and Resilient Growth
The IA Healthcare sector delivered negative returns in both 2022 and 2023, yet despite these setbacks it has still produced strong cumulative results over the five-year period. The sector returned 19.66% over six months and 32.98% across five years, reflecting the steady earnings profile of companies in pharmaceuticals, biotechnology and medical technology. While it does not display the same rapid swings as some higher-growth sectors, healthcare’s combination of resilience and lower volatility has made it a stable contributor to diversified portfolios.

European Equity Sectors Maintain Strong Momentum
European equity sectors delivered robust returns across all analysed periods. The IA Europe Excluding UK sector returned 19.05% over one year and 54.18% across five years, while the Europe Including UK sector achieved 56.12% over five years.
Calendar performance shows that, aside from a setback in 2022, the IA Europe Excluding UK sector has recorded positive growth in each year of the period reviewed. This consistency helps explain its strong cumulative results and highlights why Europe has remained an important and stable component within many diversified portfolios.
Emerging Market Equities End The Year Strong
The IA Global Emerging Markets equity sector was one of the strongest performers over the past six months, returning 19.05%. However, this followed a flat period in the previous six months, illustrating how quickly momentum can shift in this sector. The calendar sector performance also shows negative years in both 2021 and 2022, yet despite these setbacks the sector has still achieved a positive five-year cumulative return of 26.96%. This highlights how emerging markets can experience meaningful short-term fluctuations while still contributing positively over longer periods.

Latin America Remains a High-Growth Equity Region
Latin America produced some of the strongest cumulative regional returns, gaining 13.24% over three months, 19.65% over six months and 42.06% across five years. However, while recent performance has been very strong, the sector’s volatility becomes clearer when looking at the calendar year data. In 2024, the IA Latin America sector delivered a sharp decline of –25.04%, illustrating how quickly conditions in this region can shift even within a broader period of long-term growth.
Natural Resources and Commodities Deliver Standout Long-Term Results
Commodity-linked strategies delivered exceptional long-term outcomes. The IA Commodity and Natural Resources sector recorded 25.76% over six months and 79.71% across five years.
These results highlight the influence of demand for natural resources, infrastructure activity and supply constraints — all of which have supported sustained cumulative growth.

Bond Market Performance Overview
Bond markets showed pronounced variation across different sectors. Corporate and high yield bonds delivered steady results, with the IA EUR High Yield sector returning 25.74% over three years and 15.23% across five years. Calendar-year figures confirm that while there have been weaker periods, positive years have been frequent enough to support solid cumulative returns.
Government bonds, however, continued to struggle. IA UK Gilts returned minus 19.23% across five years, while Index Linked Gilts returned minus 35.94%. The calendar sector table shows significant negative performance, particularly in 2022 and 2024 for both these sectors.
Mixed Investment Strategies Provide Consistent but Moderate Returns
Mixed investment sectors delivered stable performance, with five-year returns ranging from 13.45% in the 0–35% Shares sector to 35.69% in the 40–85% Shares sector. Their diversified structure helps moderate volatility, though this typically results in more modest long-term gains compared with pure equity sectors.
The UK Market Shows Continued Signs of Recovery
Both the IA UK All Companies and IA UK Equity Income sectors recorded negative returns in 2022 and 2020, yet despite these challenging periods each still delivered strong cumulative five-year results. Over the past five years, the IA UK All Companies sector returned 48.38%, while the IA UK Equity Income sector achieved 63.03%. These figures highlight how short-term setbacks have been outweighed by sustained periods of recovery and growth within the UK market.

China Shows Short-Term Strength but Long-Term Weakness Persists
The IA China and Greater China sector returned 21.03% over six months and 27.29% over one year. However, its five-year return remains negative at minus 13.74%.
The calendar sector performance table helps explain this. After a strong year in 2020, the sector experienced three consecutive negative calendar years from 2021 to 2023, only returning to growth in 2024. Recent gains have lifted the shorter rolling periods, but the earlier declines still weigh heavily on the five-year outcome. This underlines why it is important to consider both cumulative and calendar performance when assessing any sector.
The Importance of Diversification and Risk Management
While reviewing sector performance can provide valuable insight, concentrating too heavily in the strongest recent performers can increase risk significantly. Chasing performance by overweighting sectors such as Technology or Commodities may appear attractive in the short term, but it can also expose portfolios to sharp volatility if market conditions change.
A well-structured asset allocation framework helps maintain balance, ensuring portfolios remain aligned with an investor’s agreed risk level. Sectors will always move in and out of favour, and it is common for areas with weak recent performance - such as UK equities or some bond sectors - to still play an important role within a risk-rated portfolio. Their inclusion supports diversification and helps manage the potential impact of downturns in higher-growth areas.
Maintaining a disciplined approach to diversification, rather than reacting to recent sector trends, remains central to achieving stable long-term outcomes. Book a no obligation call with an adviser to ensure your portfolio fits your risk profile and overall objectives.

Reviewing Your Portfolio Against These Sector Trends
The sector results for 2025 highlight just how varied performance has been across different areas of the market. Some sectors have delivered strong multi-year growth, while others have continued to struggle over longer periods despite short-term improvements. This wide dispersion shows why understanding how each of your funds compares with its relevant sector can be so important when assessing overall portfolio efficiency.
A portfolio analysis can help investors see clearly whether their current holdings are aligned with the stronger areas of the market or whether long-term underperformance in certain sectors may be holding back growth. By reviewing each fund against its sector average across multiple timeframes, investors gain a clearer view of strengths, weaknesses, duplication and potential gaps in diversification.
For those who would like this clarity, a Yodelar Portfolio Analysis can provide a detailed breakdown of each fund’s performance and charges, along with a comparison to similar risk models. These insights can help investors make more informed decisions about how efficiently their portfolio is positioned as they move into 2026.


