

-
Our latest analysis reviewed 100 funds in the Investment Association (IA) Japan sector, using performance data to 31 August 2026.
-
The IA Japan sector averaged 3.70% over 6 months, 25.13% over 1 year and 56.44% over 5 years, where performance data was available.
-
The highest returning fund with 5 year data returned 155.62%, while the worst performing fund returned negative 70.07%.
-
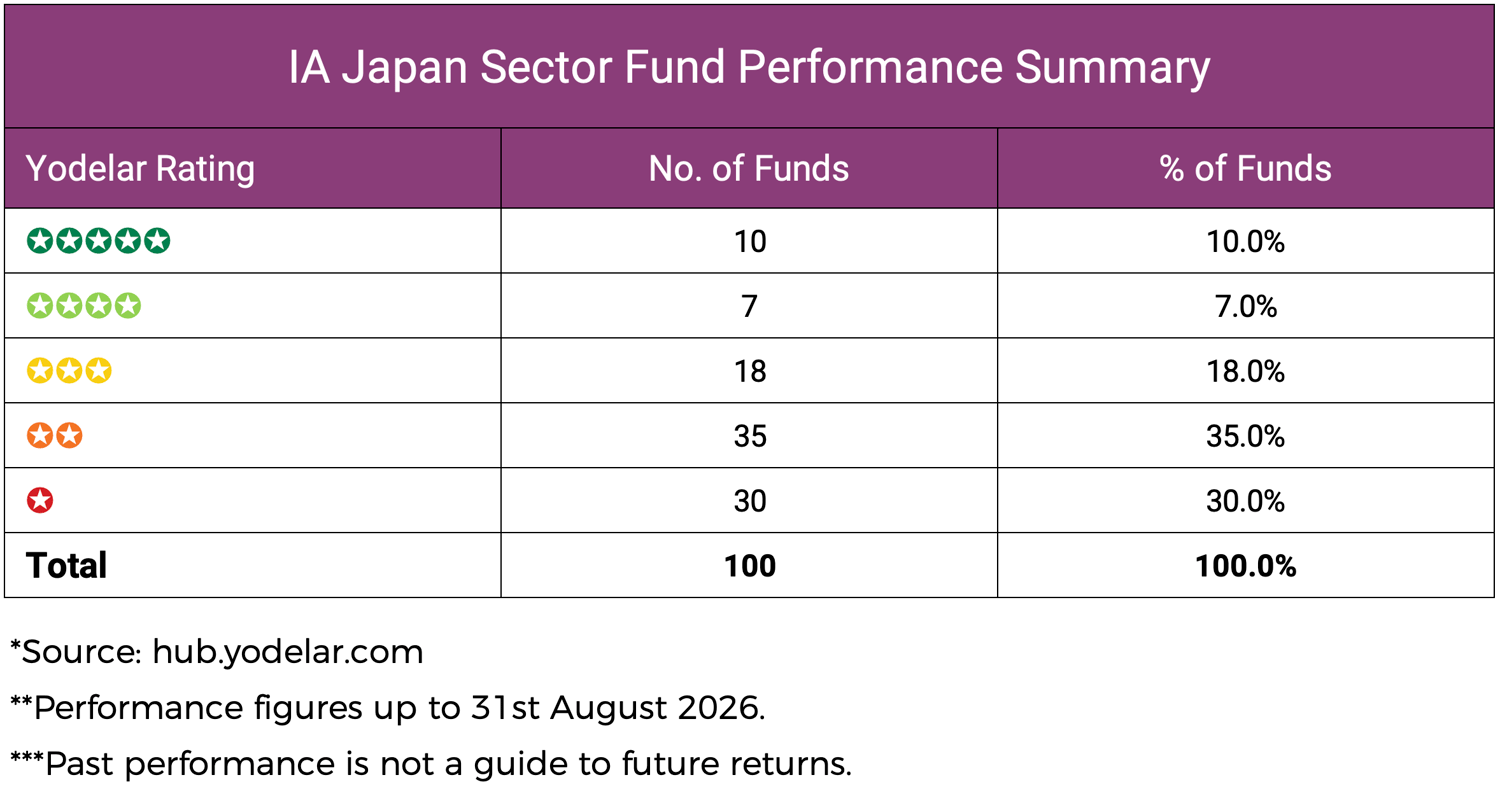
Only 17.0% of funds reviewed achieved a top performing 4 or 5 star Yodelar Rating.
-
65.0% received a weaker 1 or 2 star Yodelar Rating, showing why investors should review the specific Japan funds they hold rather than relying on sector exposure alone.
Japan funds can appeal to investors looking for exposure beyond the US and UK. They can provide access to large established businesses, exporters, financial companies, industrials, smaller companies and specialist investment styles.
But Japan exposure does not mean every fund behaves the same way.
Our latest review of 100 Investment Association (IA) Japan funds shows a wide gap between the strongest and weakest performers. The sector average was positive over the main periods reviewed, including 25.13% over 1 year and 56.44% over 5 years where data was available.
However, many funds in the sector did not consistently rank well against sector peers. Only 17.0% achieved a 4 or 5 star Yodelar Rating, while 65.0% received a 1 or 2 star rating.
For investors, the key question is not whether Japan as a market has performed well. It is whether the specific Japan fund held has performed competitively against competing funds in the same IA sector and whether it still fits the wider portfolio.

Japan Fund Performance Summary
Across the IA Japan funds reviewed, 17.0% received a top performing 4 or 5 star Yodelar Rating. In contrast, 65.0% received a weaker 1 or 2 star Yodelar Rating by ranking among the lower performers in the sector over the periods analysed.
How Yodelar Rates Fund Performance
IA Japan Sector Performance
The IA Japan sector delivered positive average returns across each period reviewed.
|
IA sector |
Average 3 Month return |
Average 6 Month return |
Average 1 year return |
Average 3 year return |
Average 5 year return |
|---|---|---|---|---|---|
|
IA Japan |
4.31% |
3.70% |
25.13% |
62.28% |
56.44% |
The sector average return over 5 years was 56.44%, based on funds with available 5-year data. That is a strong headline figure, but it hides a very wide gap between funds.
Some Japan funds delivered returns of more than 150% over 5 years. Others produced significant losses. This means investors should not assume that Japan exposure alone was enough to capture the strongest returns from the sector.
The specific fund selected made a major difference.
5 Highest Returning Japan Funds
The table below shows five of the highest 5-year returns in the IA Japan sector. These funds are not recommendations. They are included to show where the strongest historic returns were achieved within the sector.
|
Fund |
1 Mth return |
3 Mth return |
6 Mth return |
1 Year return |
3 Year return |
5 Year return |
5 Year sector rank |
Yodelar Rating |
|---|---|---|---|---|---|---|---|---|
|
WS Morant Wright Nippon Yield B Acc |
2.25% |
7.48% |
2.35% |
37.06% |
109.82% |
155.62% |
1/87 |
5 stars |
|
JK Japan Fund GBP |
4.36% |
2.91% |
6.04% |
41.27% |
118.74% |
154.54% |
2/87 |
5 stars |
|
WS Morant Wright Japan B Acc |
1.89% |
6.04% |
1.05% |
31.76% |
105.79% |
142.49% |
3/87 |
5 stars |
|
New Capital Japan Equity Acc GBP |
4.43% |
5.60% |
11.16% |
48.31% |
101.99% |
139.03% |
4/87 |
5 stars |
|
Man Japan Core Alpha C Professional Acc |
4.19% |
10.54% |
4.45% |
34.73% |
85.81% |
133.87% |
5/87 |
5 stars |
The five highest returning funds all achieved 5 star Yodelar Ratings and ranked strongly across the sector. WS Morant Wright Nippon Yield ranked 1st over 5 years, with a return of 155.62%, closely followed by JK Japan Fund at 154.54%.
These funds show that some Japan strategies delivered very strong historic results. However, investors should still avoid judging by return alone. Japan funds can follow different approaches, including income, value, growth, smaller companies or broad market exposure.
A fund with strong past performance still needs to be reviewed in the context of the wider portfolio, the investor’s objectives and the level of risk being taken.

5 Lowest Returning Japan Funds
The table below shows five of the lowest 5-year returns in the IA Japan sector. These funds are not automatically unsuitable, but their historic performance and sector rankings may warrant closer review.
|
Fund |
1 Mth return |
3 Mth return |
6 Mth return |
1 Year return |
3 Year return |
5 Year return |
5 Year sector rank |
Yodelar Rating |
|---|---|---|---|---|---|---|---|---|
|
Amundi MSCI Japan SRI Climate Paris Aligned Acc USD |
1.72% |
7.63% |
2.47% |
13.92% |
23.89% |
-70.07% |
87/87 |
1 star |
|
FTF Templeton Japan Equity W Acc GBP |
3.04% |
3.24% |
-5.07% |
16.36% |
34.83% |
-23.66% |
86/87 |
1 star |
|
Baillie Gifford Japanese Smaller Companies B Acc |
9.37% |
7.93% |
13.16% |
23.17% |
23.33% |
-21.71% |
85/87 |
1 star |
|
Nomura Japan High Conviction I JPY |
7.49% |
2.12% |
4.29% |
19.20% |
19.76% |
-14.35% |
84/87 |
1 star |
|
Lindsell Train Japanese Equity B Sterling Quoted GBP |
8.49% |
16.83% |
7.26% |
12.05% |
18.13% |
-2.33% |
83/87 |
1 star |
The weakest 5-year result in the sector came from Amundi MSCI Japan SRI Climate Paris Aligned, which fell 70.07% and ranked last among funds with 5-year data.
The lower table also shows why recent performance should not be viewed in isolation. Some of the lowest 5-year performers delivered positive 1-month, 3-month or 1-year returns. That may suggest an improvement in shorter-term performance, but it does not remove the need to review the longer-term record.
A fund that has ranked near the bottom of its sector over several periods should not be ignored. Investors should understand why it remains in the portfolio and whether it still supports the wider objective.

Why Japan Funds Can Differ So Much
Funds in the IA Japan sector can invest in very different ways.
Some focus on larger companies. Some look for income. Some invest in smaller companies. Others follow a value, growth, quality or sustainability approach. These differences can have a major impact on performance.
This is why the sector label alone is not enough. Two funds can both sit in the IA Japan sector, but one may hold very different companies and take a very different approach from another.
The gap in returns shows this clearly. The highest returning fund delivered 155.62% over 5 years, while the lowest returning fund fell by 70.07%. That is a difference of 225.69 percentage points.
For investors, the lesson is clear. Japan exposure can produce very different outcomes depending on the fund selected.

What Japan Fund Investors Should Check
Investors holding Japan funds should review both the fund itself and how the exposure fits within the wider portfolio.
|
Review question |
Why it matters |
|---|---|
|
What type of Japan exposure does the fund provide? |
Income, value, growth, sustainability and smaller company funds can behave differently. |
|
Has it ranked well against sector peers? |
A fund can benefit from a strong market but still lag competing funds in the same IA sector. |
|
Is there overlap with global or Asia funds? |
Many global and regional funds may already hold Japanese companies. |
|
Does the fund increase concentration? |
A dedicated Japan fund adds exposure to one country. |
|
Is the risk suitable? |
Japan funds can move differently from UK, US or global funds. |
|
Does the fund still have a clear role? |
Every holding should support the wider portfolio objective. |
This type of review helps investors avoid judging the fund by the country label alone.
Get A Free Portfolio Analysis
Many investors hold Japan exposure directly through Japan funds, or indirectly through global and Asia Pacific funds, without knowing how much exposure they already have.
Our free portfolio analysis reviews each fund individually, showing available 1, 3 and 5-year performance, sector ranking and Yodelar Rating. Yodelar Ratings are based on historic sector-relative performance and are not a guide to future returns.
The analysis can also help identify weaker-rated holdings, duplication, concentration, higher charges and funds that may no longer have a clear role.
It does not provide personal advice or recommend whether to buy, sell or switch any investment. It is designed to give investors a clearer view of their portfolio before deciding whether further review may be useful.

Speak To An Adviser
For investors who want to understand whether their current portfolio remains suitable, a no obligation call with an adviser from our advice partner, MKC Wealth, can help.
The discussion can cover current holdings, portfolio analysis results, objectives, time horizon and attitude to risk. It can also explain how a more structured investment approach may compare with the portfolio currently held.
Any personal recommendation would only be made after understanding the investor’s financial position, investment objectives, time horizon and attitude to risk. Any recommendation would include a clear explanation of risks, costs and ongoing service.
Summary
Japan funds delivered strong average returns over several periods, but the latest data shows why fund selection still matters.
The IA Japan sector averaged 25.13% over 1 year and 56.44% over 5 years, where data was available. However, only 17.0% of funds reviewed achieved a 4 or 5 star Yodelar Rating, while 65.0% received a 1 or 2 star rating.
The performance gap was also wide. The strongest 5-year fund returned 155.62%, while the weakest fell by 70.07%.
For investors, the message is clear. Japan exposure is not enough on its own. The specific fund, sector ranking, Yodelar Rating, risk level, overlap and portfolio role all need to be reviewed.
Before assuming a Japan fund is doing its job, investors should check how it has performed against competing funds in the same IA sector.