

- The review covered 313 funds across the IA UK All Companies, IA UK Equity Income and IA UK Smaller Companies sectors, using performance data as at 31st July 2026.
- Among the 297 funds with five-year performance, returns ranged from 126.72% to -35.28%, a difference of 162 percentage points.
- IA UK Equity Income had the highest average five-year return of the three sectors reviewed, at 59.00%.
- IA UK Smaller Companies had the lowest average five-year return, at -7.91%.
- Across all 313 funds, 23.0% received a 4 or 5-star Yodelar Rating, while 59.4% received a 1 or 2-star Yodelar rating.
One UK Label, Three Different Types of Exposure
Many investors think of UK equity funds as a single category. In reality, the three Investment Association (IA) UK sectors can behave very differently.
Funds in these three sectors are not trying to do exactly the same job. They can invest in different types of businesses, follow different styles and respond differently as market conditions change. IA UK Smaller Companies funds, for example, focus further down the market-capitalisation range than funds in the broader UK sectors.
Their objectives, holdings and risk profiles can therefore differ substantially. Comparing the sectors helps to show how different parts of the UK fund market performed, but an individual fund is more fairly judged against eligible funds in the same sector.
For investors, the key question isn’t simply whether a portfolio has UK exposure. It is what type of UK exposure it holds and how each fund has performed against comparable peers.

UK Equity Sectors Compared
The table below compares the three UK equity sectors in the dataset. Five-year figures are cumulative performance returns to 31st July 2026.
|
IA sector |
Funds reviewed |
Funds with 5-year data |
Average 5-year return |
Rated 4 or 5 stars |
Rated 1 or 2 stars |
|---|---|---|---|---|---|
|
IA UK All Companies |
203 |
189 |
41.05% |
24.1% |
57.6% |
|
IA UK Equity Income |
65 |
65 |
59.00% |
23.1% |
61.5% |
|
IA UK Smaller Companies |
45 |
43 |
-7.91% |
17.8% |
64.4% |
The five-year averages include only funds with a complete five-year record. Rating percentages use all 203, 65 and 45 funds reviewed respectively.
The table shows clear differences between the three sectors, but sector averages do not tell the whole story. A relatively high sector average can still include many funds that lagged their direct peers, while a difficult sector can contain individual funds that performed considerably better than the average.
How Yodelar Rates Fund Performance
IA UK Equity Income Had the Highest Five-Year Average
Across the 65 IA UK Equity Income funds reviewed, the average cumulative five-year return was 59.00%, the highest of the three sectors in this analysis.
However, 61.5% of funds in the sector received a 1 or 2-star Yodelar Rating. These figures measure different things. The sector average shows the level of return produced across the group, while the Yodelar Rating compares each fund with its direct peers over the available one, three and five-year periods.
A fund can therefore produce a positive return while still ranking below many comparable funds. Looking at both the sector average and the individual fund’s sector-relative record provides fuller historic context.

IA UK Smaller Companies Had the Lowest Five-Year Average
IA UK Smaller Companies had the lowest five-year average of the three sectors reviewed. Among the 43 funds with a complete five-year record, the average cumulative return was -7.91%.
Four of the five lowest five-year returns in the full dataset came from this sector. However, outcomes within IA UK Smaller Companies varied considerably. Fidelity UK Smaller Companies ranked first in the sector with a five-year return of 30.16%, while FP Octopus UK Micro Cap Growth ranked 43rd of 43 with a return of -35.28%. This created a difference of 65.44 percentage points within one sector.
This does not mean smaller-company funds should automatically be avoided. They can provide exposure to businesses that are not represented in larger-company funds, but their values can move more sharply and smaller-company shares may be harder to trade during difficult market conditions.
The figures show that the wider sector backdrop matters, but they also demonstrate why individual fund performance cannot be overlooked. They cannot tell investors which fund will deliver the highest return in future.
Five Funds with the Highest Five-Year Returns
The table below shows the five highest cumulative five-year returns among the 297 funds with sufficient data. Selection is based solely on five-year return and does not indicate overall quality, suitability or likely future performance. The sectors have different objectives and risks, so the figures are not a like-for-like comparison.
| Fund | IA sector | 6-month return | 1-year return | 3-year return | 5-year return | 5-year sector rank | Yodelar Rating |
|
Artemis SmartGARP UK Equity I Acc |
IA UK All Companies |
7.22% |
29.86% |
99.18% |
126.72% |
1 of 189 |
5 stars |
|
Dimensional UK Value Acc |
IA UK All Companies |
10.38% |
33.17% |
88.53% |
117.50% |
2 of 189 |
5 stars |
|
Ninety One UK Special Situations I Acc GBP |
IA UK All Companies |
8.28% |
20.03% |
91.36% |
113.58% |
3 of 189 |
4 stars |
|
Vanguard FTSE UK Equity Income Index A Acc GBP |
IA UK Equity Income |
10.95% |
31.23% |
79.78% |
106.72% |
1 of 65 |
5 stars |
|
BNY Mellon UK Income Inst W Acc |
IA UK Equity Income |
9.71% |
26.44% |
69.30% |
103.68% |
2 of 65 |
4 stars |
All five funds returned more than 100% over five years. Artemis SmartGARP UK Equity ranked first among the 189 IA UK All Companies funds with five-year data, while Vanguard FTSE UK Equity Income Index ranked first among the 65 eligible IA UK Equity Income funds.
These figures provide useful historic context, but a sector rank alone does not show whether a fund took more risk, held a more concentrated portfolio, charged less, experienced management changes or would suit a particular investor.

Five Funds with the Lowest Five-Year Returns
The following funds had the five lowest cumulative five-year returns among the 297 funds with sufficient data. A low historic return does not, by itself, establish that a fund is unsuitable. Its objective, risk, holdings, charges and role within the wider portfolio also matter.
| Fund | IA sector | 6-month return | 1-year return | 3-year return | 5-year return | 5-year sector rank | Yodelar Rating |
|
FP Octopus UK Micro Cap Growth P Acc |
IA UK Smaller Companies |
-0.10% |
6.65% |
4.26% |
-35.28% |
43 of 43 |
1 star |
|
abrdn UK Mid Cap Equity I Acc |
IA UK All Companies |
0.89% |
0.09% |
7.92% |
-31.76% |
189 of 189 |
1 star |
|
WS Amati UK Listed Smaller Companies B Acc |
IA UK Smaller Companies |
-1.82% |
1.04% |
4.20% |
-29.75% |
42 of 43 |
1 star |
|
FTF ClearBridge UK Smaller Companies W Acc |
IA UK Smaller Companies |
-0.92% |
-3.06% |
6.28% |
-28.57% |
41 of 43 |
1 star |
|
Liontrust UK Smaller Companies I Inc |
IA UK Smaller Companies |
-8.72% |
-10.78% |
-4.98% |
-27.94% |
40 of 43 |
1 star |
Four of the five funds in this table are from IA UK Smaller Companies, the sector with the lowest five-year average in this review. Their sector ranks also show that other funds in the same sector recorded higher historic returns.
Holding one of these funds does not, by itself, indicate that it should be sold. Any review would also need to consider the sector backdrop, investment style, manager or process changes, risk, charges and the fund’s role within the wider portfolio.
What UK Equity Investors Should Review
| Question | Why it matters |
|
Which UK sector is the fund in? |
IA UK All Companies, IA UK Equity Income and IA UK Smaller Companies can behave very differently. |
|
How has it ranked against comparable sector peers? |
A headline return becomes more useful when viewed alongside eligible funds following a broadly similar mandate. |
|
Has performance been consistent across different periods? |
A five-year result can be materially influenced by performance during a shorter part of the period. |
|
How much risk and concentration does the fund carry? |
Higher historic returns can sometimes be linked to narrower exposure or larger price movements. |
|
Is the UK exposure duplicated elsewhere? |
Global, multi-asset and tracker funds may already hold many of the same UK companies. |
|
What does the fund cost, and has anything material changed? |
Charges, manager changes, changes to how the fund is run and a revised objective can all affect how it should be assessed. |
Working through these questions can give investors a clearer view of what each holding contributes and where further review may be worthwhile.

Sector Matters, But It Does Not Tell the Whole Story
The results show that “UK equity” is too broad a label on which to judge a fund. The sectors follow different mandates, individual outcomes can vary widely, and a relatively high sector average can still include many funds with weaker peer-relative records.
Historic rankings can help investors identify useful questions, but they cannot show which fund will produce the highest future return or determine suitability. A fuller review also needs to consider the fund’s objective, risk, charges, holdings and role within the wider portfolio.
See How Your Own Funds Compare
Many investors hold UK funds alongside global funds, mixed investment funds and trackers without a clear view of how each holding ranks against comparable funds.
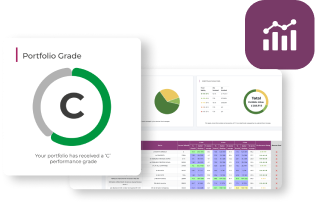
Our free portfolio analysis reviews each holding, showing its available one, three and five-year cumulative performance, IA sector rank and Yodelar Rating. It can also help identify holdings with lower historic sector-relative ratings, duplicated exposure and areas of portfolio concentration.
The analysis is factual and does not provide personal advice or tell you to buy, sell or switch an investment. Its purpose is to give you a clearer view of your current holdings before deciding whether any area warrants closer review.

Speak to an Adviser
Investors who want to understand whether their portfolio remains suitable can request a no-obligation call with an adviser from our advice partner, MKC Wealth.
The discussion can cover current holdings, portfolio-analysis findings, objectives, time horizon and attitude to risk. Any personal recommendation would only be made after the adviser had gathered sufficient information about the investor’s financial position, objectives, tax position and wider circumstances, and assessed suitability.