


-
Our review assessed 18 Rathbone funds across 1, 3, and 5-year periods, comparing their returns with relevant sector averages.
-
Only one fund, the Rathbone Enhanced Growth Portfolio S Acc GBP, achieved a 4-star rating for consistent results across multiple timeframes.
-
Fourteen of the 18 funds received 1 or 2-star ratings, reflecting results that were below their respective sector averages.
- Funds within the Greenbank range generally returned less than their sector averages across all timeframes.
Rathbones is one of the UK’s longest-established wealth and investment management firms, with a heritage dating back to 1742. As of 30th September 2025, the group manages approximately £113 billion in funds under management and administration (FUMA), placing it among the largest independent investment houses in the country.
The firm’s investment philosophy combines active management, disciplined risk control, and a growing emphasis on responsible investing. Rathbones has earned a strong reputation for long-term stewardship and professional expertise, attracting both retail and institutional investors who value its consistent approach to wealth management.
In this 2025 review, we analysed the performance of 18 Rathbone funds, each measured against their relevant Investment Association (IA) sector averages over 1, 3, and 5 years. This assessment provides a factual insight into how Rathbone’s funds have performed relative to their peers, highlighting areas of strength and identifying where performance has lagged.
Our findings show that while Rathbones maintains a respected position within the industry, fund performance across its range has been mixed. Of the 18 funds analysed, only one achieved a 4-star rating, while the majority have delivered results below their respective sector averages. These results underline the importance of active fund selection and performance monitoring — even among well-established investment brands.

Rathbone Fund Performance Summary
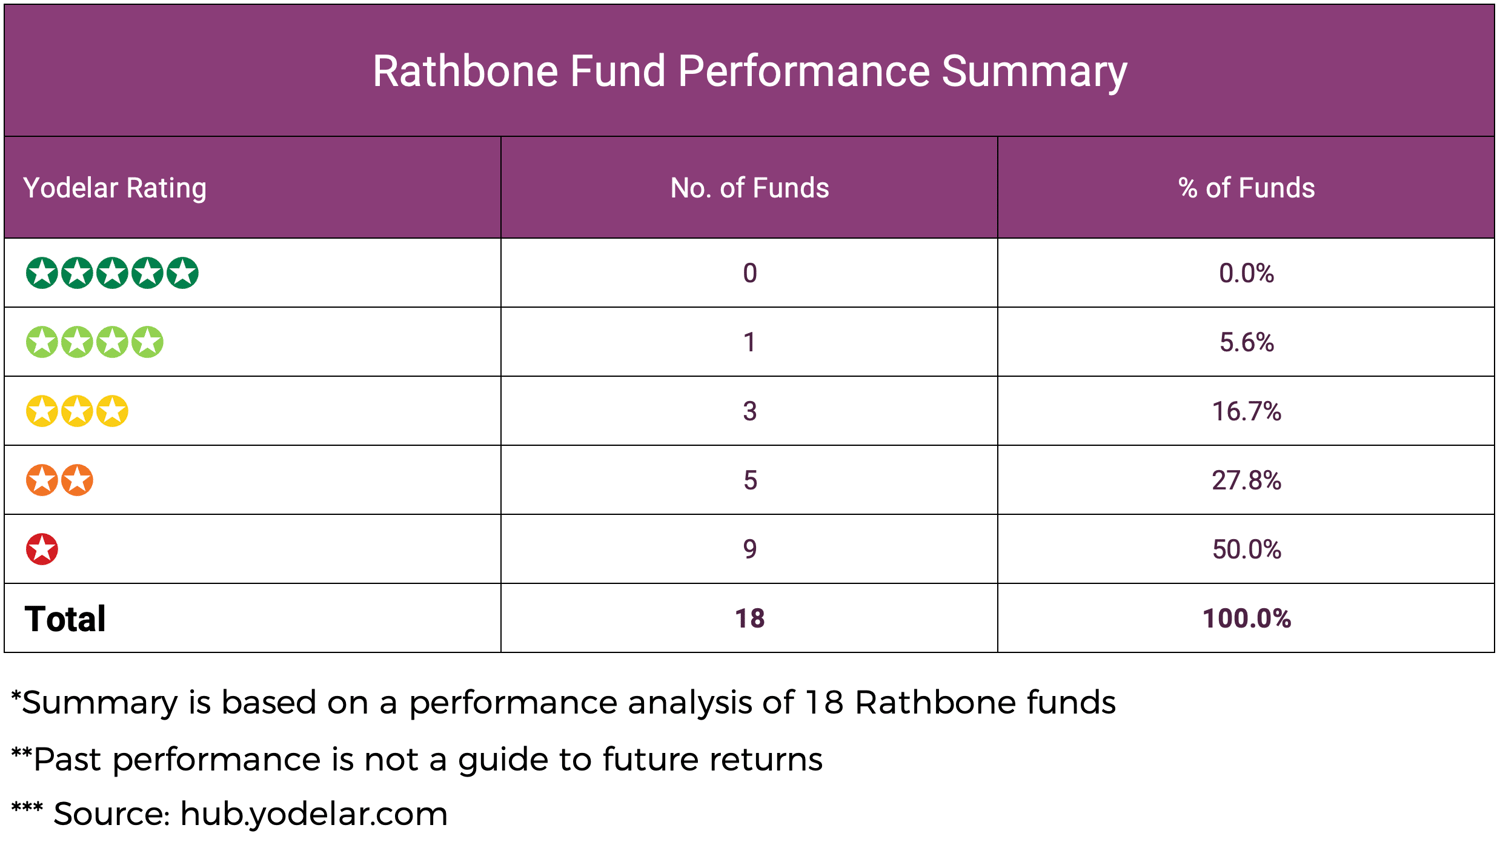
Our analysis of 18 Rathbone funds assessed each strategy’s performance and sector ranking over 1, 3, and 5-year periods. Every fund was evaluated and assigned a Yodelar rating based on its returns relative to the average of its Investment Association (IA) sector.
The results show a clear pattern. Only one fund achieved a 4-star rating, indicating consistent outperformance over multiple timeframes, while none reached the top 5-star level. At the other end of the scale, 14 funds — representing more than three-quarters of the range — received a 1 or 2-star rating, signalling persistent underperformance relative to their peers.
This variation highlights the uneven nature of Rathbone’s fund range. While a small number of funds have maintained competitive results, most have struggled to keep pace with sector averages. The findings emphasise the importance of ongoing performance monitoring and careful selection within any single fund group, regardless of brand reputation or history.
How Yodelar Rates Fund Performance

Rathbone Fund Performance Analysis
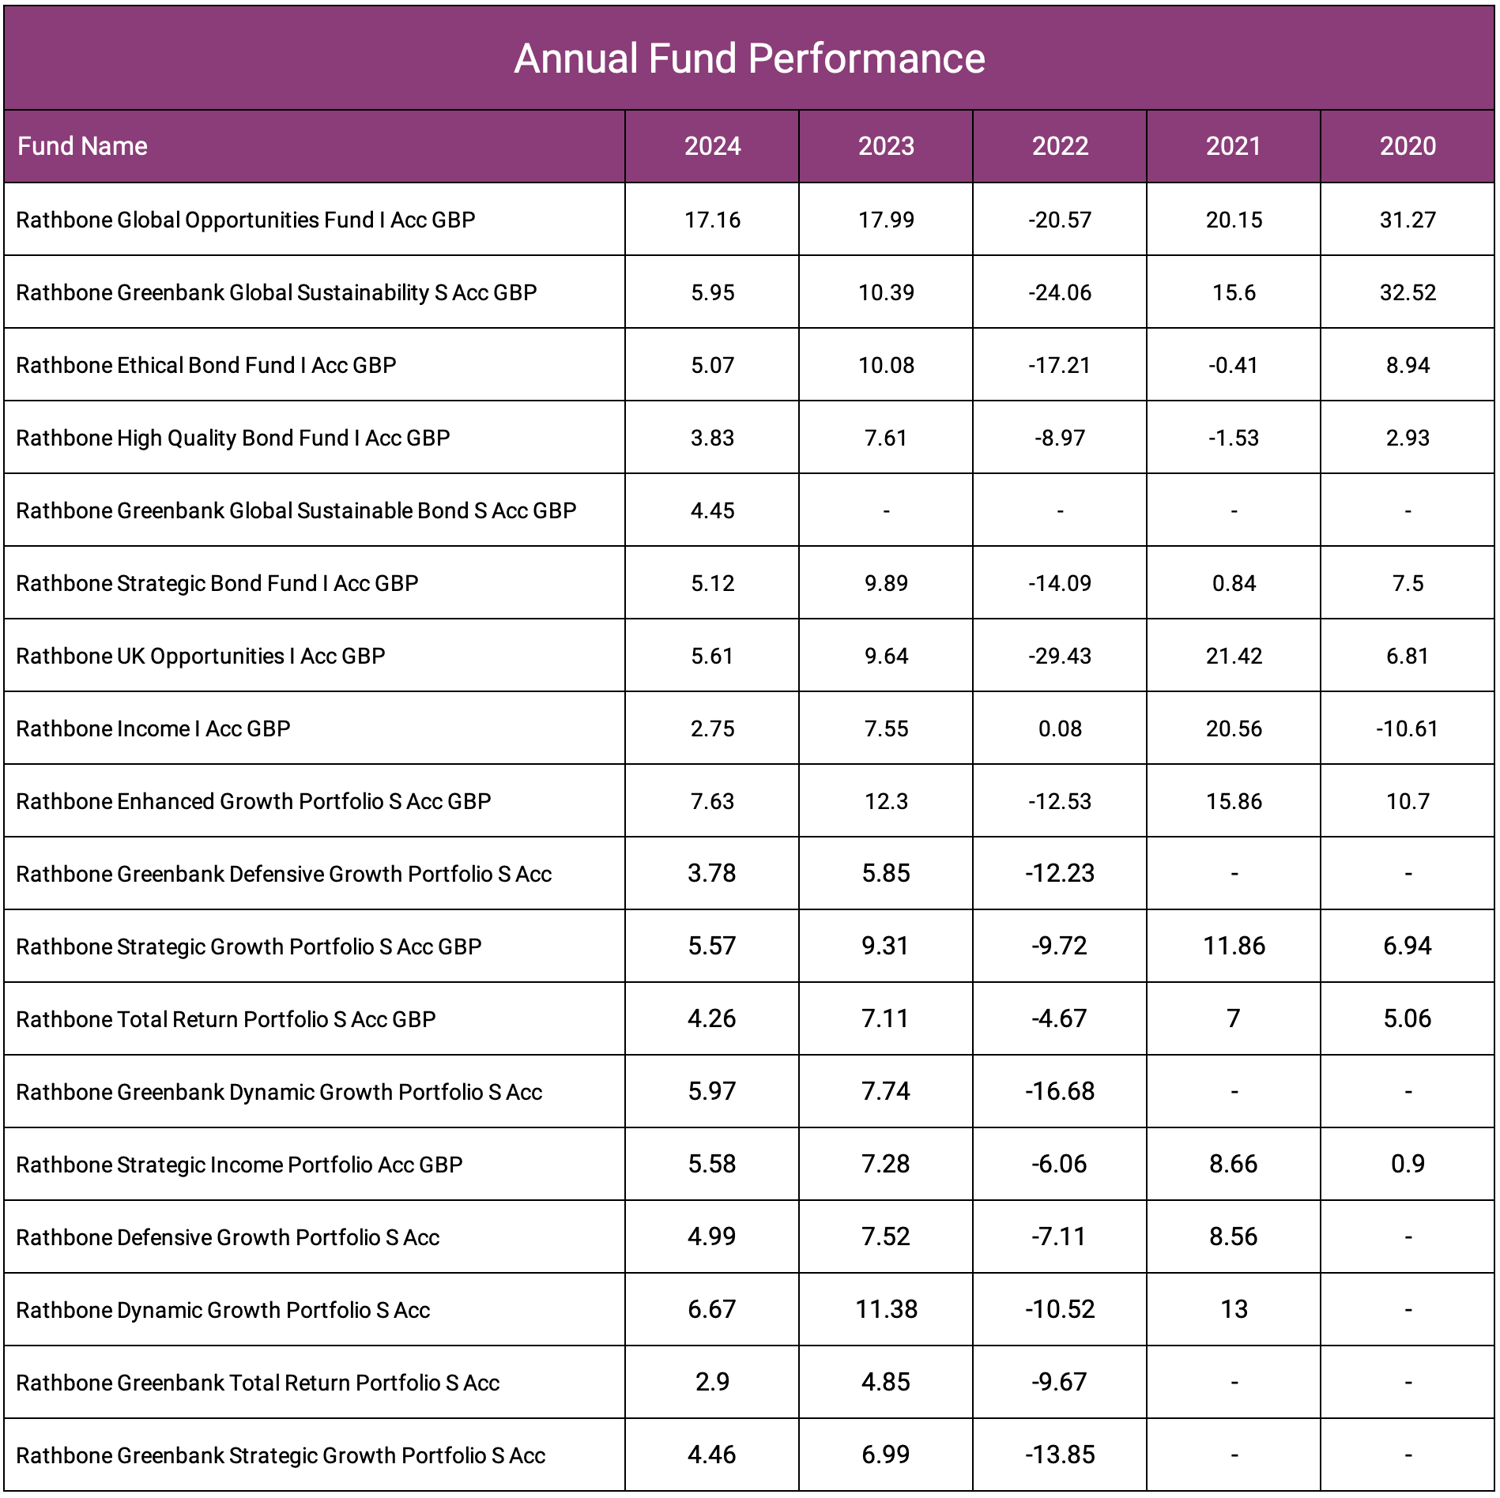
The table below highlights the performance of 18 Rathbone funds compared with their respective sector averages over 1-, 3-, and 5-year periods.

Rathbone Global Opportunities Fund
The Rathbone Global Opportunities Fund has delivered mixed results over recent years, with periods of relative strength followed by weaker phases in global equity markets. Over one year, it returned 10.07%, slightly below the sector average of 11.16%. Over three years, it returned 44.85% compared with 35.47% for the sector, supported by effective stock selection through varied market conditions. Over five years, it returned 50.64%, below the sector average of 62.22%. With an ongoing charge figure (OCF) of 0.76%, the fund is competitively priced and provides broad exposure to global equities.
Rathbone Greenbank Global Sustainability Fund
The Rathbone Greenbank Global Sustainability Fund has struggled to match its peers within the IA Global sector. Over one year, it returned 4.93%, compared with 11.16% for the sector. Over three years, it returned 22.30% versus 35.47%, and over five years, it returned 24.86% compared with 62.22%. With an OCF of 0.59%, the fund is relatively expensive versus peers. While it maintains strong ethical and ESG credentials, recent performance has lagged broader global equity markets.
Rathbone Ethical Bond Fund
The Rathbone Ethical Bond Fund has produced steady and consistent returns across all measured periods. Over one year, it returned 4.31%, marginally ahead of the sector average of 4.00%. Over three years, it returned 27.08% compared with 23.13% for the sector, placing it among the stronger performers within its category. Over five years, it returned 5.07%, ahead of the sector’s small decline of –0.61%. With an OCF of 0.65%, the fund is well-priced for an actively managed ethical bond strategy and has benefited from a disciplined focus on responsibly managed issuers.
Rathbone High Quality Bond Fund
The Rathbone High Quality Bond Fund has produced steady results, reflecting its focus on investment-grade credit and government bonds. Over one year, it returned 4.67%, ahead of the sector average of 4.00%. Over three years, it returned 21.51%, just below the sector’s 23.13%. Over five years, it returned 5.68%, ahead of the sector’s –0.61%. With an OCF of 0.30%, the fund remains cost-effective and demonstrates a consistent, risk-aware approach to fixed income investing.
Rathbone Greenbank Global Sustainable Bond Fund
Since its launch in 2023, the Rathbone Greenbank Global Sustainable Bond Fund has produced modest early results. Over one year, it returned 4.83%, slightly below the sector average of 5.02%. Due to its short track record, long-term data is not yet available. With an OCF of 0.40%, costs are higher than average. Its sustainability focus and disciplined framework provide a strong foundation, though more time will be needed to assess its long-term competitiveness.
Rathbone Strategic Bond Fund
The Rathbone Strategic Bond Fund has delivered varied results across different timeframes. Over one year, it returned 4.23%, slightly below the sector average of 5.02%. Over three years, it returned 24.51%, ahead of the sector’s 21.77%, and over five years, it returned 9.72%, below the sector’s 11.70%. With an OCF of 0.58%, costs are above average. The fund’s flexible approach allows it to adjust exposure to bonds and interest rates as conditions change, though overall results have been inconsistent.
Rathbone UK Opportunities Fund
The Rathbone UK Opportunities Fund has underperformed across most periods within the IA UK All Companies sector. Over one year, it returned 2.19%, compared with 8.31% for the sector. Over three years, it returned 32.30% versus 36.54%, and over five years, it returned 23.81%, well below the sector average of 61.77%. The fund’s OCF of 0.61%.
Rathbone Income Fund
The Rathbone Income Fund has produced modest results within the IA UK Equity Income sector. Over one year, it returned 7.98%, below the sector average of 9.58%. Over three years, it returned 35.04% versus 40.75%, and over five years, it returned 72.11% compared with 78.83%. With an OCF of 0.78%, the fund’s charges are competitive, but performance has consistently lagged peers in recent years.
Rathbone Enhanced Growth Portfolio
The Rathbone Enhanced Growth Portfolio has been one of the stronger performers within the IA Volatility Managed sector. Over one year, it returned 11.08%, compared with 8.30% for the sector. Over three years, it returned 37.47% versus 26.54%, and over five years, it returned 48.47% compared with 33.90%. With an OCF of 0.56%, the fund is among the lowest-cost options in its category. Its disciplined allocation across equities, bonds, and alternative assets has supported consistent returns within its risk parameters.

Rathbone Greenbank Defensive Growth Portfolio
The Rathbone Greenbank Defensive Growth Portfolio has produced weaker results within the IA Volatility Managed sector. Over one year, it returned 2.32%, compared with 8.30% for the sector. Over three years, it returned 13.39%, below the sector’s 26.54%. With an OCF of 0.58%, costs are reasonable, but returns have not yet met the fund’s inflation-plus target.
Rathbone Strategic Growth Portfolio
The Rathbone Strategic Growth Portfolio has delivered consistent results within the IA Volatility Managed sector. Over one year, it returned 8.54%, compared with 8.30% for the sector. Over three years, it returned 27.84% versus 26.54%, and over five years, it returned 35.24% compared with 33.90%. The fund’s OCF of 0.55% is higher than average but supported by steady long-term performance.
Rathbone Total Return Portfolio
The Rathbone Total Return Portfolio has underperformed its IA Volatility Managed peers. Over one year, it returned 6.04% compared with 8.30% for the sector. Over three years, it returned 19.91% versus 26.54%, and over five years, it returned 24.99% compared with 33.90%. With an OCF of 0.55%, the fund is relatively expensive given its cautious positioning and below-average returns.
Rathbone Greenbank Dynamic Growth Portfolio
The Rathbone Greenbank Dynamic Growth Portfolio aims to deliver returns above inflation over rolling five-year periods but has underperformed its sector. Over one year, it returned 2.99%, compared with 8.30% for the sector. Over three years, it returned 19.09% versus 26.54%. Its sustainable approach has reduced exposure to sectors such as energy and defence, which have performed strongly, impacting overall returns.
Rathbone Strategic Income Portfolio
The Rathbone Strategic Income Portfolio has shown subdued results within the IA Volatility Managed sector. Over one year, it returned 5.07%, compared with 8.30% for the sector. Over three years, it returned 24.63% versus 26.54%, and over five years, it returned 31.05% compared with 33.90%. With an OCF of 0.58%, the fund’s costs are relatively high, and its cautious focus on income generation has limited its growth potential during market upturns.
Rathbone Defensive Growth Portfolio
The Rathbone Defensive Growth Portfolio aims to deliver returns above inflation (CPI + 2%) over five-year periods. Over one year, it returned 7.14%, compared with 8.30% for the sector. Over three years, it returned 22.39% versus 26.54%, and over five years, it returned 28.21% compared with 33.90%. With an OCF of 0.54%, the fund remains cost-efficient, though its defensive stance has limited upside participation during stronger markets.
Rathbone Dynamic Growth Portfolio
The Rathbone Dynamic Growth Portfolio has delivered solid results within the IA Volatility Managed sector. Over one year, it returned 9.69% versus 8.30% for the sector. Over three years, it returned 33.22% compared with 26.54%, and over five years, it returned 42.35% versus 33.90%. With an OCF of 0.55%, the fund provides cost-efficient exposure to diversified growth assets and has maintained consistency across multiple timeframes.
Rathbone Greenbank Total Return Portfolio
The Rathbone Greenbank Total Return Portfolio has persistently underperformed peers within the IA Volatility Managed sector. Over one year, it returned 2.19% versus 8.30% for the sector. Over three years, it returned 11.55% compared with 26.54%. The fund’s cautious structure and currency hedging have limited upside during market recoveries, while rising bond yields have weighed on returns since 2022.
Rathbone Greenbank Strategic Growth Portfolio
The Rathbone Greenbank Strategic Growth Portfolio has produced below-average results within its sector. Over one year, it returned 2.43%, compared with 8.30% for the sector. Over three years, it returned 16.45% versus 26.54%. The fund’s sustainable, multi-asset approach aims to balance growth with responsibility, though limited exposure to higher-growth sectors has restrained performance.
Summary
Rathbone remains one of the UK’s most established and recognised fund management groups, known for its long history and disciplined investment process. However, the findings from this review show a mixed picture across its fund range.
Of the 18 funds analysed, only one achieved a 4-star rating, while 14 received low ratings of 1 or 2 stars, reflecting sustained periods of underperformance relative to their sector averages. This variation reinforces that size and reputation do not guarantee consistent investment success.
Although a small number of Rathbone strategies have demonstrated resilience, particularly within their bond and multi-asset portfolios, the broader trend has been less competitive. The data suggests that many funds have found it difficult to maintain long-term consistency, particularly against wider market peers.
For investors, this underlines the value of understanding both the investment approach of the portfolio manager, along with the underlying funds they are selecting within the portfolio, and not just brand or heritage.
Diversification and Oversight: The Foundations of Long-Term Success
The varied results across Rathbone’s fund range highlight an important investment principle — no single manager or fund performs consistently across every market cycle. Even well-managed strategies experience periods of underperformance, while others benefit from prevailing trends.
A resilient portfolio depends not on individual fund results but on structure, diversification, and adaptability. Each holding should serve a clear purpose within a portfolio that balances risk and opportunity across regions, sectors, and asset classes.
Equally important is ongoing oversight. Without regular review, portfolios can drift away from their intended structure, leaving investors either overexposed to risk or too defensively positioned. Integrating performance analysis within a structured management process helps maintain balance and ensure alignment with evolving objectives.
Long-term success is rarely the result of one fund or one decision. It comes from discipline, clarity, and continuous management — ensuring portfolios remain efficient, diversified, and well positioned through changing market conditions.


