- Over 5 years, the IA North America sector averaged 83.24% growth, outpacing both IA UK All Companies (61.77%) and IA UK Smaller Companies (29.26%).
- The Alger Focus Equity fund topped the IA North America sector, returning 142.12% over 5 years compared with the sector’s 83.24%.
- The Artemis SmartGARP UK Equity fund returned 179.42% over 5 years, far exceeding the IA UK All Companies average of 61.77%.
- The TM Redwheel UK Equity Income fund combined strong income focus with capital growth, delivering 145.69% over 5 years versus the IA UK Equity Income sector average of 78.83%.
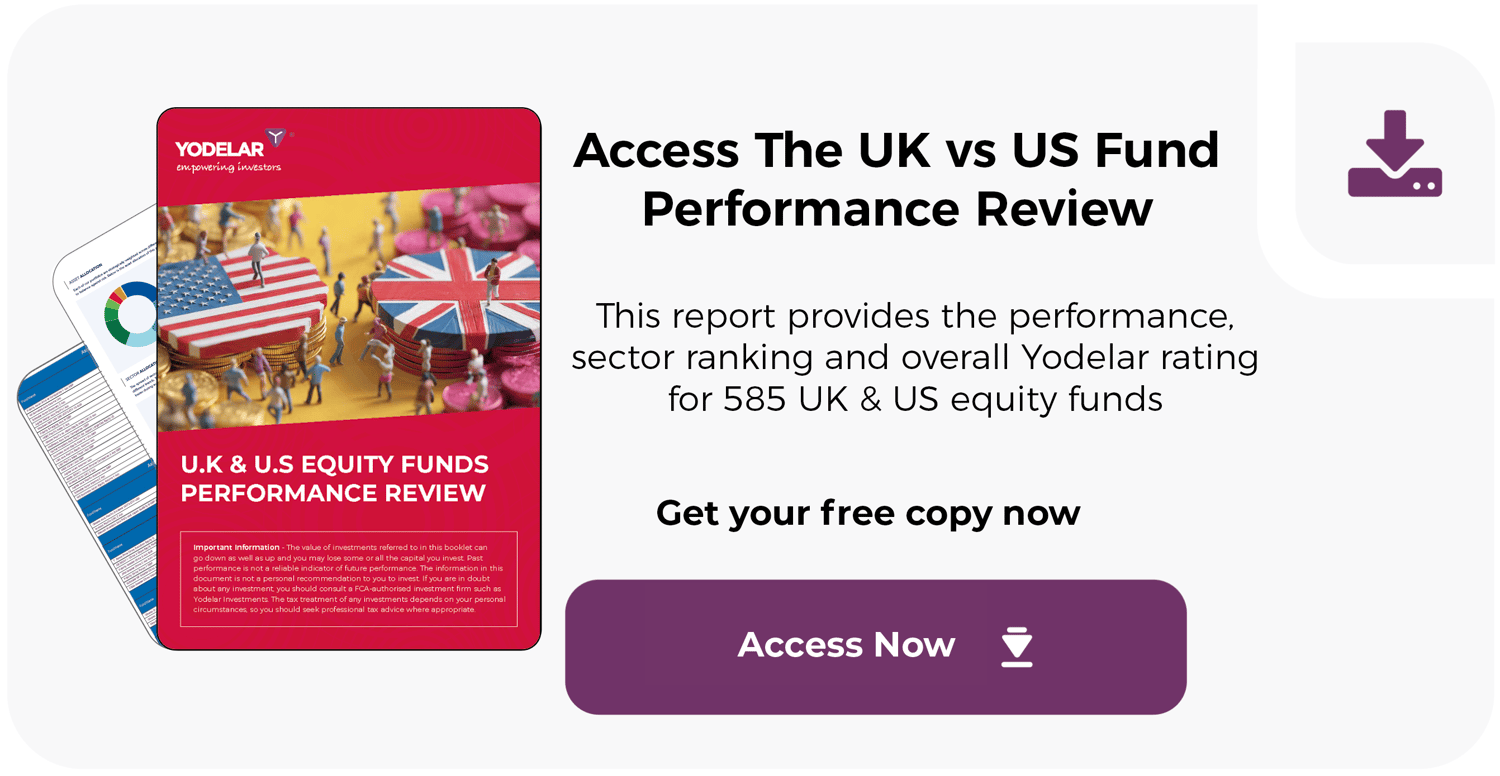
The UK and US are home to two of the world’s most influential equity markets, yet their funds have often delivered very different outcomes. Both regions have faced changing conditions in recent years - from volatility and market shocks to periods of recovery - creating a wide gap between the strongest and weakest performers. Comparing UK and US equity funds provides a clear view of how managers in each market have navigated these challenges.
Our latest review analysed 585 Investment Association funds across the IA North America, IA UK All Companies, IA North America Smaller Companies, IA UK Equity Income and IA UK Smaller Companies sectors. By assessing performance over 6 months, 1 year, 3 years and 5 years, we identified those that consistently ranked above their sector peers and those that consistently underperformed.
In this article, we feature 10 of the best-performing funds - five from UK equity sectors and five from US equity sectors. Their results highlight the differences between the two regions, but also show that strong outcomes are not limited to one market alone.
UK & US Equity Fund Performance Summary
Our analysis of 585 Investment Association funds highlights a wide range in performance outcomes. Only 7.5% of funds achieved a 5-star Yodelar Rating for consistently ranking in the top quartile of their sector over 1, 3 and 5 years. By contrast, 58.3% of funds received a rating of 1 or 2 stars, meaning they frequently placed in the lower half of their peer groups.


The sector averages indicate that large-cap US equity funds within the IA North America sector have delivered stronger long-term growth, with IA UK Equity Income sector funds posting returns that are not far behind.
Over 5 years, the IA North America sector averaged growth of 83.24%, compared with 61.77% for IA UK All Companies and 78.83% for IA UK Equity Income. UK Smaller Companies funds recorded the weakest results, averaging just 29.26% over the same period, reflecting the challenges faced by this part of the market in recent years. However, shorter-term figures show a stronger rebound in the sector, underlining how performance can vary significantly across different timeframes.
10 Top Performing UK & US Equity Funds
From the 585 funds reviewed, we identified 10 that consistently outperformed their sector peers across multiple timeframes. These include 5 North American equity funds and 5 UK equity funds. Alger’s US growth strategies stand out, with two funds included in the list. Both follow a high-conviction approach that has benefited from exposure to some of the strongest-performing US companies in recent years. In the UK, Artemis funds also feature twice, with their blend of value-driven and selective strategies helping them deliver competitive results across different market cycles.
Alongside these, high-ranking ETFs such as Xtrackers MSCI USA Information Technology and Invesco Nasdaq-linked funds highlight the strength of passive strategies in capturing US technology growth. Together, these funds show the variety of approaches that have produced top-quartile performance across the UK and US equity sectors.
Below we provide commentary on each of the 10 funds, including their recent and long-term performance, sector comparisons, charges (OCF), and strategy focus.


Alger Focus Equity Fund
The Alger Focus Equity fund has been one of the strongest performers in the IA North America sector. Over 6 months it returned 40.68% compared with the sector average of 9.27%. Over 1 year it delivered 52.80% versus 13.01%, and over 5 years it achieved 142.12% against 83.24%. These results place it consistently among the very best funds in its peer group.
With an Ongoing Charge Figure (OCF) of 0.70%, the fund is priced competitively against its sector peers, with IA North America funds averaging 0.84% a year. Its focused approach, investing in a smaller group of US growth companies, has boosted returns during strong market periods, although such concentration can also increase risk if individual holdings struggle.
Alger American Asset Growth Fund
The Alger American Asset Growth fund has also produced excellent results within the IA North America sector. Over 6 months it returned 36.84% compared with a sector average of 9.27%. Over 1 year it delivered 46.82% versus 13.01%, and over 5 years it achieved 122.50% compared with 83.24%. Its rankings have placed it firmly in the top quartile throughout.
The fund carries a relatively high OCF of 2.08%, more than double the 0.84% sector average, making it one of the more expensive funds in its sector. Its active strategy focuses on US companies with strong long-term growth potential, and despite the higher charges, its performance over multiple timeframes shows that the approach has delivered competitive results.
Artemis SmartGARP UK Equity Fund
The Artemis SmartGARP UK Equity fund has been a consistent leader in the IA UK All Companies sector. Over 6 months it grew 18.37% versus the sector average of 7.52%. Over 1 year it returned 34.32% against 8.31%, and over 5 years it achieved 179.42% compared with 61.77%. These results place it among the top performers across all periods.
The fund uses Artemis’ quantitative SmartGARP process to identify UK companies with both value and growth potential. Its OCF of 1.31% is higher than the sector average of 0.88%, but the strategy’s tilt towards mid-sized UK firms has supported its strong performance, particularly in periods when smaller and mid-cap companies have outperformed larger peers.
Xtrackers MSCI USA Information Technology UCITS ETF
This ETF has delivered standout performance within the IA North America sector. Over 6 months it gained 28.65% compared with 9.27% for the sector. Over 1 year it returned 26.84% against 13.01%, and over 5 years it achieved 155.46% versus 83.24%. Rankings place it consistently near the top of its category.
With an OCF of just 0.12%, this is one of the lowest-cost funds in the sector. It tracks the MSCI USA Information Technology Index, giving investors exposure to some of the largest and fastest-growing US technology firms. Its results reflect the strong performance of the technology sector in recent years.
Artemis UK Select Fund
The Artemis UK Select fund has also delivered strong results in the IA UK All Companies sector. Over 6 months it returned 14.57% compared with the sector average of 7.52%. Over 1 year it grew 25.93% versus 8.31%, and over 5 years it achieved 161.98% against 61.77%. These outcomes position it among the top quartile across multiple periods.
With an OCF of 1.29%, the fund is more expensive than the IA UK All Companies sector average of 0.88%. It follows a high-conviction approach, investing in a smaller group of UK companies. This style has supported results during periods of market strength, although, as with other concentrated strategies, performance can be more variable when individual holdings struggle.
TM Redwheel UK Equity Income Fund
The TM Redwheel UK Equity Income fund has consistently ranked among the stronger performers in the IA UK Equity Income sector. Over 6 months it returned 11.85% compared with the sector average of 7.78%. Over 1 year it gained 22.85% versus 9.58%, and over 5 years it achieved 145.69% against 78.83%. These results place it firmly within the top quartile across each period measured.
With an OCF of 0.60%, the fund is competitively priced relative to the sector average of 1.08%. Its objective is to provide investors with both income and capital growth through investment in UK companies, and its track record shows it has delivered consistently stronger outcomes than many of its peers over the periods analysed.
Ninety One UK Special Situations Fund
The Ninety One UK Special Situations fund has ranked highly within the IA UK All Companies sector. Over 6 months it returned 15.97% against the sector average of 7.52%. Over 1 year it gained 22.66% versus 8.31%, and over 5 years it delivered 184.62% compared with 61.77%. Its performance places it among the sector’s strongest funds over all periods measured.
The fund has an OCF of 1.59%, which is high compared to the 0.88% sector average, but its returns show strong value with performance figures net of funds charges. The strategy looks for UK companies undergoing restructuring or change, aiming to benefit from share price recovery. This contrarian style has at times increased volatility, but its long-term results have been among the strongest in the sector.
Redwheel UK Value Fund
The Redwheel UK Value fund has been a competitive performer in the IA UK Equity Income sector. Over 6 months it returned 11.28% compared with a sector average of 7.78%. Over 1 year it achieved 22.39% versus 9.58%, and over 5 years it delivered 130.82% compared with 78.83%. Rankings place it firmly in the top quartile.
The fund carries an OCF of 1.06%, which is slightly below the 1.08% average for the IA UK Equity Income sector. The fund follows a value-based approach, investing in UK companies with attractive dividend yields and the potential for share price recovery. Its results show that the style has worked well relative to other income strategies within the sector.
Invesco NASDAQ-100 ESG UCITS ETF
The Invesco NASDAQ-100 ESG ETF has also been among the top performers in the IA North America sector. Over 6 months it grew 19.91% against the sector average of 9.27%. Over 1 year it returned 22.22% compared with 13.01%, and over 5 years it achieved 83.69% versus 83.24%.
The fund has an OCF of 0.49% which is lower than many of its peers as it simply tracks the NASDAQ 100 ESG Index. The fund offers relatively low cost exposure to some of the largest US growth companies while applying environmental, social and governance filters.
Invesco EQQQ NASDAQ 100 UCITS ETF
The Invesco EQQQ NASDAQ 100 ETF has also delivered consistently strong results within the IA North America sector. Over 6 months it returned 18.46% compared with a sector average of 9.27%. Over 1 year it gained 22.17% versus 13.01%, and over 5 years it achieved 112.30% compared with 83.24%. Its long-term track record has kept it among the top-performing funds in the sector.
The fund carries an OCF of 0.30%, making it one of the lower-cost ways to access the NASDAQ 100 Index. It provides diversified exposure to many of the world’s largest US growth companies, particularly in technology and communications, which have been the key drivers of its competitive performance.
Summary
The analysis of 585 funds across UK and US equity sectors shows just how wide the performance gap can be between funds in the same markets. While both regions produced top-quartile performers, only a small number of funds consistently achieved results well above their sector averages. The majority fell closer to or below the mid-point of their peer groups.
Notably, strong results were found in both UK and US funds, each benefiting from different styles and exposures. UK strategies with a focus on value and recovery opportunities performed well, while US funds with exposure to technology and growth companies dominated at the top end of their sector. This mix of outcomes reinforces the importance of looking beyond headline growth and understanding how each fund ranks within its sector.
For investors, the findings highlight that performance can vary significantly depending on strategy, sector focus, and market conditions. Comparing funds to their sector averages provides essential context and helps identify where portfolios may be supported by strong performers or held back by weaker ones.
Why Diversification and Oversight Are Key
The varied results of UK and US equity funds show that no single region, strategy, or fund provider has a monopoly on performance. Some funds excel in certain conditions, while others fall behind, and these dynamics change over time. A resilient portfolio depends on having the right balance - spreading investments across markets and strategies while ensuring each holding contributes positively to long-term objectives.
Access to the full market of funds and managers gives investors and advisers greater scope to build efficient portfolios. Professional oversight adds an additional layer of protection, allowing for timely adjustments and rebalancing that help portfolios remain aligned with changing market conditions and personal goals.
Simply selecting funds that have performed well in the past is not enough. Sustainable success relies on structured, ongoing management that blends diversification, evidence, and discipline. A Yodelar Portfolio Analysis can help identify whether your portfolio is supported by competitive funds or held back by underperformers. By reviewing your holdings against sector peers, you can take meaningful steps to improve efficiency, reduce risks, and position your investments for stronger long-term growth.
Why Professional Oversight Matters
This review and the accompanying downloadable report highlight how fund performance can vary widely, even within the same sector or region. Some funds have consistently delivered top-quartile results, while many others have fallen behind. For investors, the challenge is not just identifying strong performers, but ensuring their portfolio remains balanced, diversified, and aligned with long-term goals as market conditions change.
Professional oversight, such as the discretionary investment management offered by MKC Invest via MKC Wealth, allows timely adjustments without client delays, helping portfolios stay aligned with market conditions and investor goals. By combining structured planning with disciplined portfolio management, MKC Wealth aims to help investors avoid being held back by underperforming funds or inefficient structures.
The evidence suggests advice adds value - but the quality of that advice matters most. To see how your own portfolio compares and explore where improvements could be made, you can book a no obligation call with one of our advisers today.


