

-
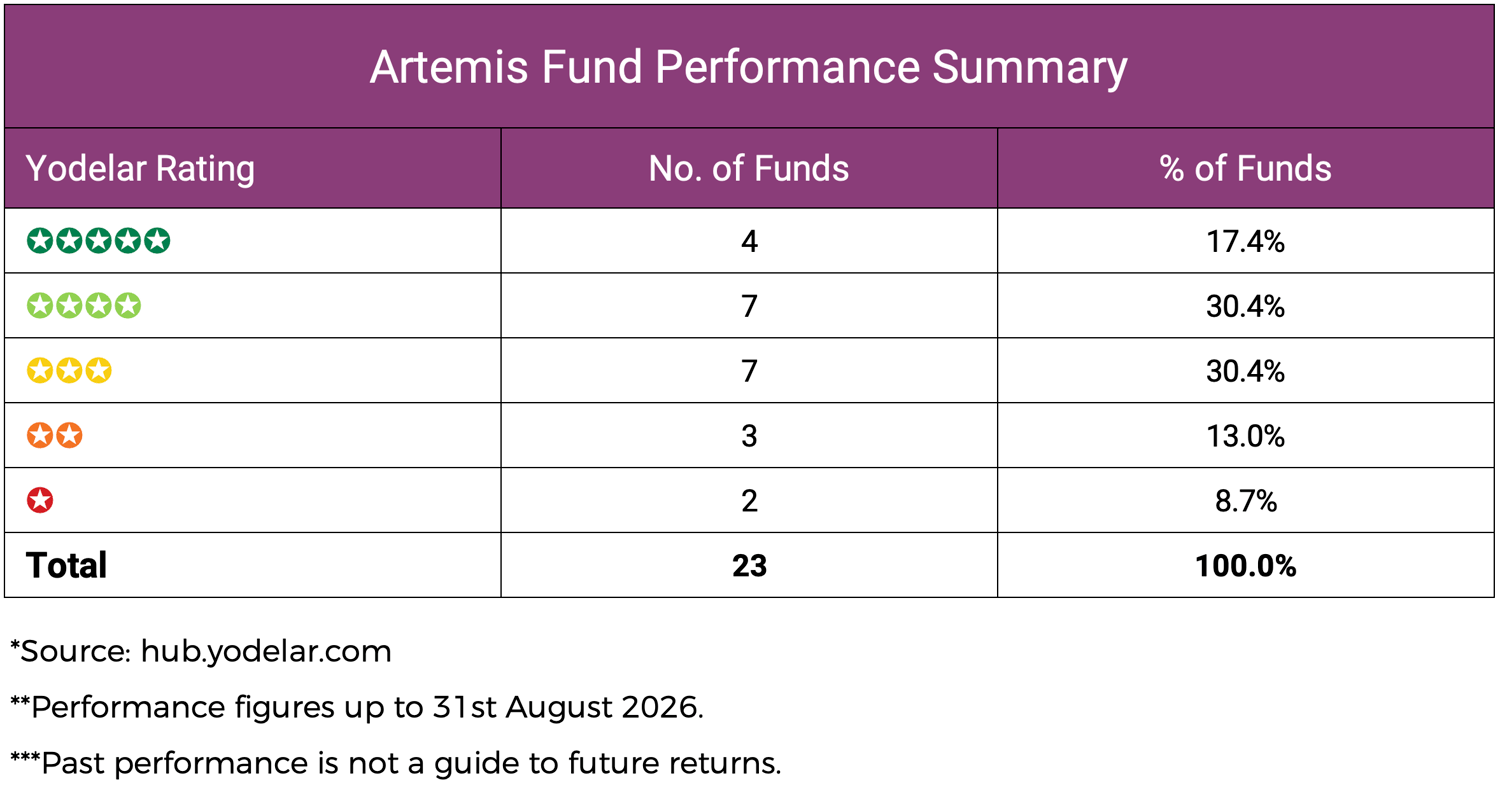
We reviewed 23 Artemis funds using performance data to 31 August 2026. Of these, 11 received a 4 or 5 star Yodelar Rating, representing 47.8% of the funds analysed.
-
Five funds, representing 21.7% of the range reviewed, received a 1 or 2 star rating. These ratings need to be read alongside each fund’s performance history and sector rankings.
-
Artemis Global Income ranked first in its sector over 1, 3 and 5 years, with a five year return of 165.27%.
-
Artemis SmartGARP European Equity and Artemis SmartGARP UK Equity also ranked first in their sectors over five years, returning 147.03% and 127.16% respectively.
-
Artemis Income illustrates why different periods matter. Its five year return of 71.18% ranked 18th out of 65 sector peers, but its one year return ranked 49th.
Artemis is an established UK fund manager with a range covering UK and overseas shares, bonds and income investing. Founded in 1997, it focuses on active management, giving its investment teams the freedom to select investments rather than simply follow a market index.
For investors, the appeal is the opportunity for those decisions to deliver stronger results. However, active management does not guarantee outperformance, and a successful fund does not tell the whole story of a provider’s range.
This review examines the performance and investment approaches behind Artemis funds using data to 31 August 2026. Whether you already hold Artemis funds or are considering investing in them, it provides a clear view of how they have performed compared with competing funds in the same Investment Association (IA) sectors.

Artemis Fund Performance Summary
Across the 23 Artemis funds reviewed, 47.8% received a 4 or 5 star Yodelar Rating, while 21.7% received a 1 or 2 star rating. The remaining 30.4% received a 3 star rating.
How Yodelar Rates Fund Performance
Five Highest Returning Artemis Funds
The table shows the five highest five year returns among the 22 Artemis funds with sufficient history. These funds invest in different markets, so their sector rankings provide important context. The order below does not account for differences in risk or establish which fund is suitable for an individual investor.
|
Fund |
IA sector |
6 Mth return |
1 Year return |
3 Year return |
5 Year return |
5 Year sector ranking |
Yodelar Rating |
|---|---|---|---|---|---|---|---|
|
Artemis Global Income I Inc |
IA Global Equity Income |
5.73% |
38.27% |
152.14% |
165.27% |
1/51 |
4 stars |
|
Artemis SmartGARP European Equity I Acc |
IA Europe Excluding UK |
5.38% |
29.98% |
119.50% |
147.03% |
1/132 |
5 stars |
|
Artemis SmartGARP UK Equity I Acc |
IA UK All Companies |
2.62% |
27.77% |
107.69% |
127.16% |
1/189 |
5 stars |
|
Artemis SmartGARP Global Equity I Acc |
IA Global |
14.53% |
45.15% |
113.56% |
117.43% |
11/429 |
4 stars |
|
Artemis SmartGARP Global Emerging Markets Equity I Acc GBP |
IA Global Emerging Markets |
8.64% |
46.75% |
107.50% |
107.42% |
4/146 |
5 stars |
Performance figures up to 31st August 2026. Source: hub.yodelar.com. Past performance is not a guide to future returns.

Artemis Global Income
Artemis Global Income returned 165.27% over five years, ranking first out of 51 funds in the IA Global Equity Income sector. It also ranked first over one and three years, with returns of 38.27% and 152.14%. Its leading position therefore extended beyond one measurement period.
The fund aims to grow both income and capital by investing in companies worldwide. Its managers look for businesses that generate cash and have the potential to grow their dividends, including companies outside the most familiar income holdings. That approach differs from simply selecting the shares with the highest current yield. The performance figures should not be mistaken for the amount of income an investor received.
Artemis SmartGARP European Equity
Artemis SmartGARP European Equity returned 147.03% over five years, ranking first out of 132 funds in the IA Europe Excluding UK sector. Its three year return of 119.50% also ranked first, while its one year return of 29.98% placed second.
The fund invests predominantly in European companies outside the UK. Rather than tracking the market, it uses the SmartGARP process to identify companies combining growth with relatively low share prices compared with their financial results. This gives investors a different approach from a European index fund, although it can also lead to periods when performance moves away from the wider market.
Artemis SmartGARP UK Equity
Artemis SmartGARP UK Equity returned 127.16% over five years and 107.69% over three years, ranking first in the IA UK All Companies sector over both periods. Its one year return of 27.77% ranked third out of 202 funds.
The fund applies the same financial screening process to a predominantly UK share portfolio. Its holdings are selected for their investment characteristics rather than their size in a market index. The results show that this approach ranked strongly against sector peers over the periods reviewed, but they do not establish that the same approach will lead in future.
Artemis SmartGARP Global Equity
Artemis SmartGARP Global Equity returned 117.43% over five years, ranking 11th out of 429 funds in the IA Global sector. It also ranked eighth over three years and 11th over one year, placing it among the leading funds across all three periods.
The fund searches across global markets using SmartGARP, rather than following the composition of a global index. For investors, the distinction is important: it provides worldwide exposure, but the selection of companies reflects a particular investment approach. Its holdings can therefore differ substantially from those of a conventional global tracker.
Artemis SmartGARP Global Emerging Markets Equity
Artemis SmartGARP Global Emerging Markets Equity returned 107.42% over five years, ranking fourth out of 146 sector peers. Its three year return of 107.50% ranked sixth, while its one year return of 46.75% ranked 29th out of 169 funds. It received a 5 star Yodelar Rating.
The fund applies SmartGARP to companies in emerging markets, seeking businesses with attractive growth characteristics at prices the manager considers reasonable. It is not a substitute for a developed market or broad global fund. The countries and companies available to it are different, so its role needs to be considered alongside the rest of the portfolio.

How SmartGARP Selects Companies
Four of the five highest returning funds use SmartGARP. Understanding the process helps explain what this part of the Artemis range has in common.
SmartGARP uses company data to identify growing businesses whose share prices appear reasonable against their financial results. It examines information such as profit growth and changes to profit forecasts, with fund managers checking the data before investment decisions are made. The approach combines computer screening with manager judgement rather than relying on either alone.
For investors holding more than one SmartGARP fund, the shared process is worth understanding. Different regional funds may spread investments across countries, but they still use a similar method to select companies. That does not make holding them together inappropriate; it means diversification should be assessed by investment approach as well as geography.
Artemis Funds With Lower Ratings
The following five funds received 1 or 2 star ratings in the supplied data. They are not necessarily the five lowest returning Artemis funds. Some combined competitive five year results with weaker rankings over other periods, while Artemis Atlas had a much shorter history.
|
Fund |
IA sector |
6 Mth return |
1 Year return |
3 Year return |
5 Year return |
5 Year sector ranking |
Yodelar Rating |
|---|---|---|---|---|---|---|---|
|
Artemis Strategic Assets I Acc |
IA Flexible Investment |
-1.22% |
11.81% |
9.71% |
25.22% |
102/141 |
1 star |
|
Artemis Atlas I Acc GBP |
IA Targeted Absolute Return |
-4.96% |
-2.95% |
Not available |
Not available |
Not available |
1 star |
|
Artemis Global High Yield Opportunities I Acc USD |
IA Sterling High Yield |
1.79% |
5.43% |
22.91% |
26.20% |
8/25 |
2 stars |
|
Artemis Income I Inc |
IA UK Equity Income |
4.04% |
14.47% |
65.84% |
71.18% |
18/65 |
2 stars |
|
Artemis Income (Exclusions) Acc |
IA UK Equity Income |
4.48% |
14.49% |
65.94% |
68.40% |
20/65 |
2 stars |
Performance figures up to 31st August 2026. Source: hub.yodelar.com. Past performance is not a guide to future returns.
Artemis Strategic Assets
Artemis Strategic Assets returned 25.22% over five years, ranking 102nd out of 141 funds in the IA Flexible Investment sector. Its three year return of 9.71% placed 154th out of 155 funds. Although both figures were positive, the sector positions show that the fund lagged many competing funds, particularly over three years.
The manager can adjust exposure to different investments, including shares, bonds and cash, in response to market conditions. That flexibility makes it different from a fund that mainly follows share markets. Its record should therefore be considered alongside its stated objective and the role it was selected to fulfil. Artemis also changed the fund’s investment policy in May 2025, so the longer performance periods span that change.
Artemis Atlas
Artemis Atlas returned -2.95% over one year, ranking 65th out of 68 funds in the IA Targeted Absolute Return sector. Its six month return was -4.96%. These results explain why its early performance deserves attention, but they should not be described as a long record of underperformance.
The fund launched in July 2025 and aims to achieve positive returns over three years by seeking opportunities in both rising and falling company share prices. At the review date, it had not completed that three year objective period. Its approach involves additional risks and does not guarantee a positive return.
Artemis Global High Yield Opportunities
Artemis Global High Yield Opportunities returned 26.20% over five years, ranking eighth out of 25 funds in the IA Sterling High Yield sector. Its three year return of 22.91% ranked 19th out of 25, while its one year return ranked eighth out of 26.
This is a mixed record rather than uniformly weak performance. The five year ranking was stronger than the three year position, which is why the rating needs to be read alongside the individual results. The table does not establish how much income was distributed or whether the fund met a particular investor’s income requirements.
Artemis Income
Artemis Income returned 71.18% over five years, ranking 18th out of 65 funds in the IA UK Equity Income sector. Over three years it also ranked 18th, but its one year return of 14.47% placed 49th. That distinction matters: the fund’s weaker recent ranking should not be presented as evidence that its entire longer term record was poor.
The strategy focuses on companies’ ability to generate cash and maintain or increase dividends. Investors reviewing the fund should consider its recent sector position alongside that income objective, rather than relying exclusively on either the five year return or the 2 star rating.
Artemis Income Exclusions
Artemis Income Exclusions returned 68.40% over five years, ranking 20th out of 65 sector peers. Its one year return of 14.49% ranked 48th, so it also combined a stronger longer term position with a weaker recent ranking.
The fund follows an approach similar to Artemis Income but excludes certain businesses, including specified tobacco, gambling, weapons and fossil fuel activities. These restrictions affect the companies available to the manager and can influence performance when excluded industries perform strongly. Investors should understand those restrictions rather than treating the two income funds as identical.

Lower Returns Are Not Always Weaker Results
The highest return table is dominated by equity funds, but it does not include every Artemis fund with a strong sector record.
Artemis High Income returned 24.67% over five years, considerably less than the equity funds featured above. However, it ranked fourth out of 73 funds in the IA Sterling Strategic Bond sector and received a 5 star Yodelar Rating. Artemis Monthly Distribution returned 69.27% and ranked first out of 171 funds in IA Mixed Investment 20 to 60% Shares.
These examples show why replacing a lower returning fund with a higher returning equity fund is not automatically an improvement. The change may also increase exposure to share markets or alter the portfolio’s intended balance. The relevant test is how each fund performed against its sector peers and whether it continues to fulfil its purpose.
Get A Free Portfolio Analysis
Knowing how an Artemis fund ranks is useful. Knowing how it fits alongside everything else you hold gives you a fuller picture.
Upload a recent portfolio statement, or provide your fund names and approximate values, for a free analysis. We review available 1, 3 and 5 year performance, sector rankings and Yodelar Ratings across your holdings. Where information is available, the analysis can also identify possible duplication and concentration.
The service provides factual information, not personal advice or a recommendation to buy, sell or switch. There is no obligation to make changes or proceed with advice.

Speak To An Adviser
To discuss the findings alongside your retirement plans, income needs or investment objectives, book a no obligation call with an adviser from our advice partner, MKC Wealth.
Any personal recommendation would follow a fuller assessment of your circumstances, objectives, attitude to risk and ability to withstand losses. The risks, costs and ongoing service would be explained before you decide whether to proceed.

Summary
The Artemis range included several funds with leading sector records, particularly Global Income and the SmartGARP European and UK strategies. Those results deserve recognition, but the review also identifies funds with weaker rankings, mixed records and shorter histories that require a different assessment.
For investors, the useful conclusion is not to favour or avoid the entire range. It is to understand the record behind each holding. A lower return may reflect a different investment purpose, while an impressive five year figure can sit alongside weaker recent results.
Before adding to an Artemis fund or leaving an existing holding unchanged, check its sector rankings, understand its approach and consider what it contributes to the portfolio. A free portfolio analysis provides a practical starting point for bringing that information together.