

-
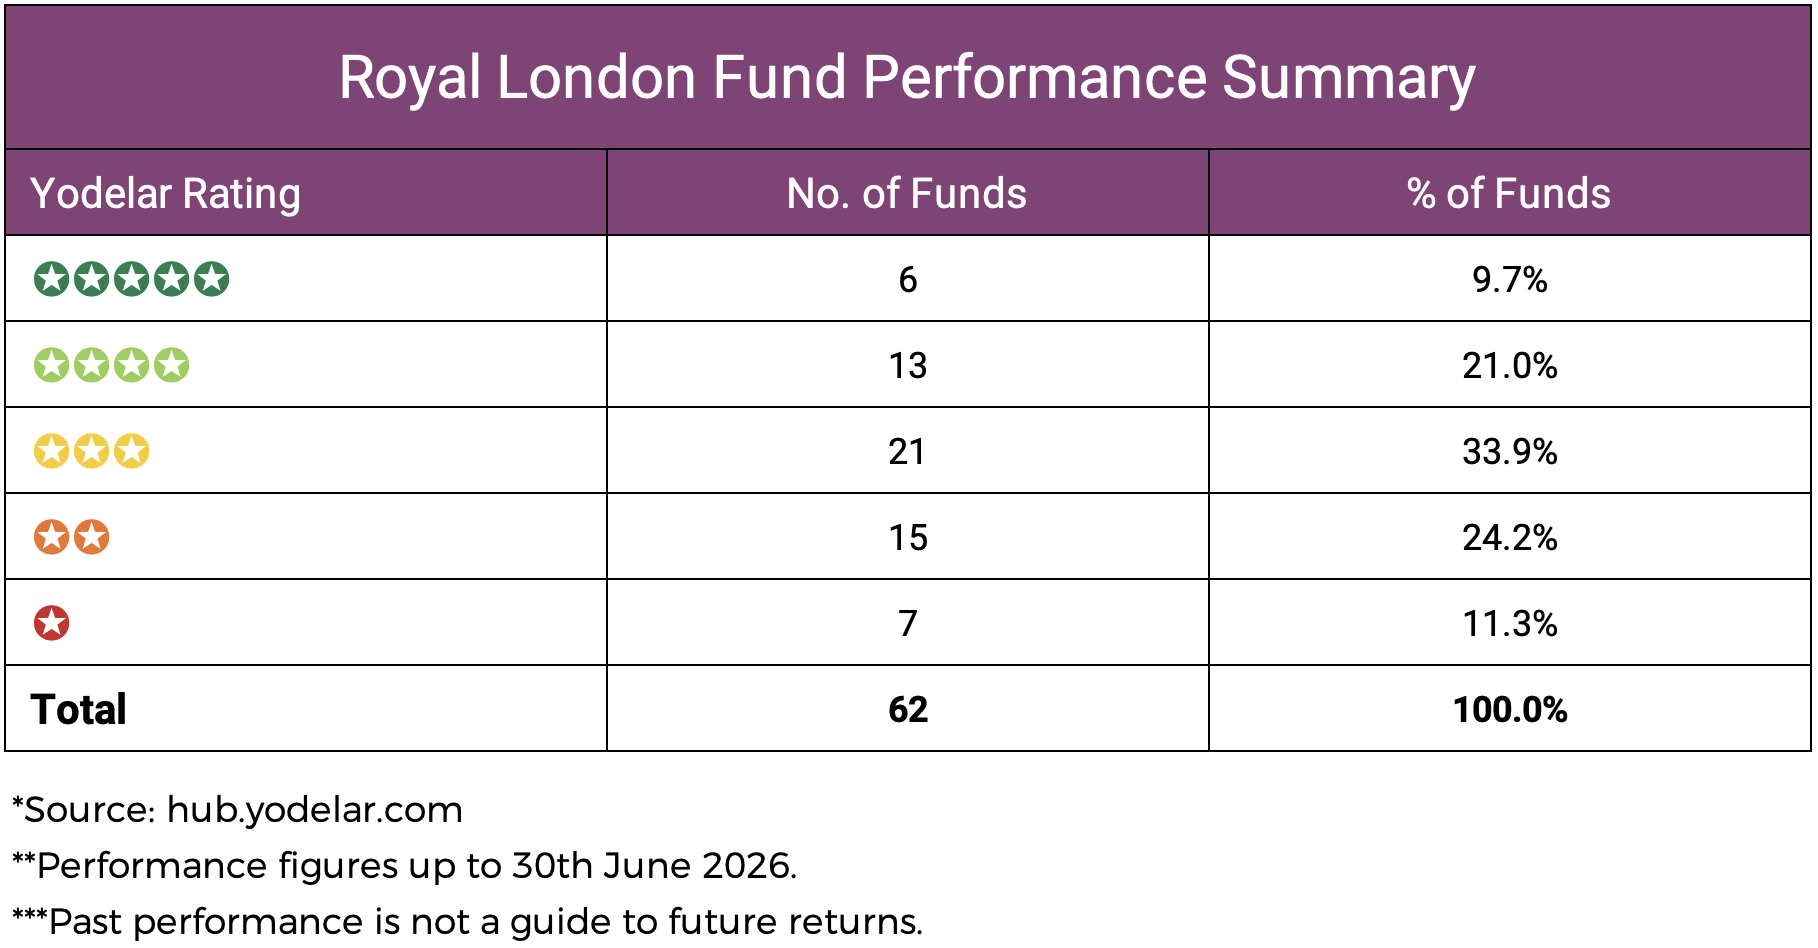
We reviewed 62 Royal London funds with available Investment Association sector data.
-
The average Royal London fund returned 6.14% over 6 months, 14.67% over 1 year, 36.95% over 3 years and 32.87% over 5 years.
-
30.6% of Royal London funds reviewed achieved a 4 or 5 star Yodelar Rating.
-
35.5% were rated 1 or 2 stars, showing a clear split between stronger and weaker historic performance profiles.
-
The range included several funds with strong sector rankings, but also funds that ranked poorly against their sector peers.
Royal London is one of the UK’s most recognised investment brands, with funds used across ISAs, pensions and self-invested portfolios.
That familiarity can give investors confidence. But it should not be mistaken for evidence that every Royal London fund has performed strongly against its sector peers.
Our latest analysis reviewed 62 Royal London funds from the Investment Association (IA) sector-classified fund universe, using performance data to 30 June 2026. The results show a fund range with clear strengths, but also several funds that have ranked poorly against competing funds in the same sector.
Some Royal London funds ranked strongly over 1, 3 and 5 years. Others sat in the weaker Yodelar Rating bands, including funds in UK Smaller Companies, UK All Companies, Sterling Strategic Bond and mixed investment sectors.
For investors, the key question is not whether Royal London is a good or bad fund group. That is too broad. The more useful question is whether the specific Royal London funds held in a portfolio have performed competitively or if other funds may actually be more suitable alternatives.
Royal London Fund Performance Summary
Across the Royal London funds reviewed 31% received a top performing 4 or 5 star Yodelar rating. In contrast, 35% received a poor 1 or 2 star rating by ranking among the bottom of their sectors for performance over the periods analysed.
How Yodelar Rates Fund Performance
5 Of The Best Performing Royal London Funds
The table below highlights five Royal London funds with some of the strongest 5-year returns in the dataset. These funds are not recommendations. They are included to show where Royal London funds delivered stronger historic results compared with competing funds in the same IA sector.
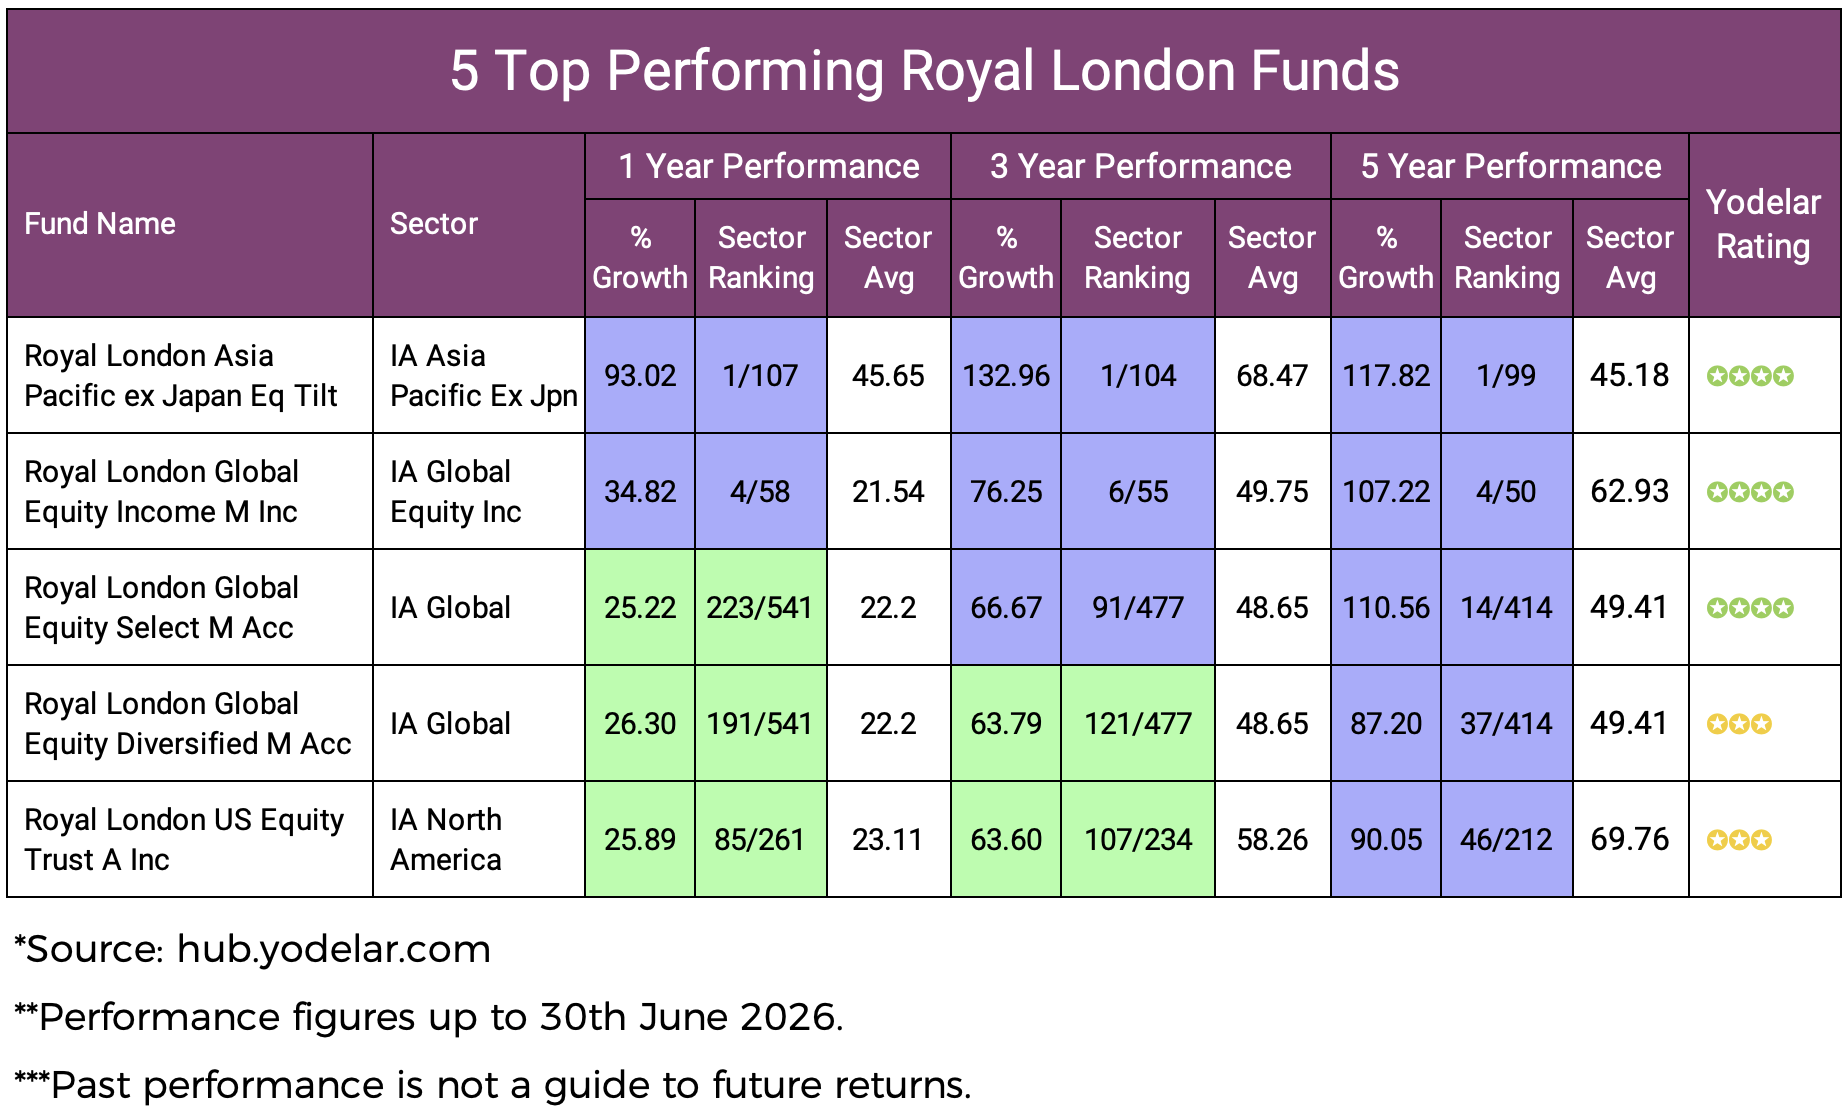
The standout fund in this group was Royal London Asia Pacific ex Japan Equity Tilt, which ranked 1st out of 99 funds in the IA Asia Pacific Excluding Japan sector over 5 years. Its 5-year return of 117.82% was not just strong in absolute terms; it was also the strongest result in its sector.
Royal London Global Equity Select and Royal London Global Equity Income also ranked well over 5 years, both achieving 4 star Yodelar Ratings. These are examples of Royal London funds that have delivered strong results compared with sector peers.
However, investors should still read these figures carefully. A fund delivering strong returns may carry a different level of risk, sector exposure or investment style than another fund in the same portfolio. A strong fund is only useful if it fits the investor’s wider objectives and risk profile.
What The Stronger Funds Show
The stronger Royal London funds were mainly concentrated in equity sectors, including Asia Pacific, global equities, global equity income and North America.
That is important because these funds have benefited from market areas that have performed strongly over the periods reviewed. Their results show that Royal London has funds that have ranked competitively, but they also show why sector context is essential.
A global equity fund, an Asia Pacific fund and a money market fund are not trying to do the same job. Investors should therefore avoid comparing all funds by return alone. The better test is whether each fund has performed well against competing funds in the same IA sector.
This is where sector ranking is useful. It helps investors separate a genuinely strong fund from a fund that only looks strong because the wider market has risen.
5 Of The Worst Performing Royal London Funds
The table below shows five Royal London funds with weaker 5-year performance and lower Yodelar Ratings. These funds are not automatically unsuitable for every investor, but their historic performance and sector rankings show why they may warrant closer review.
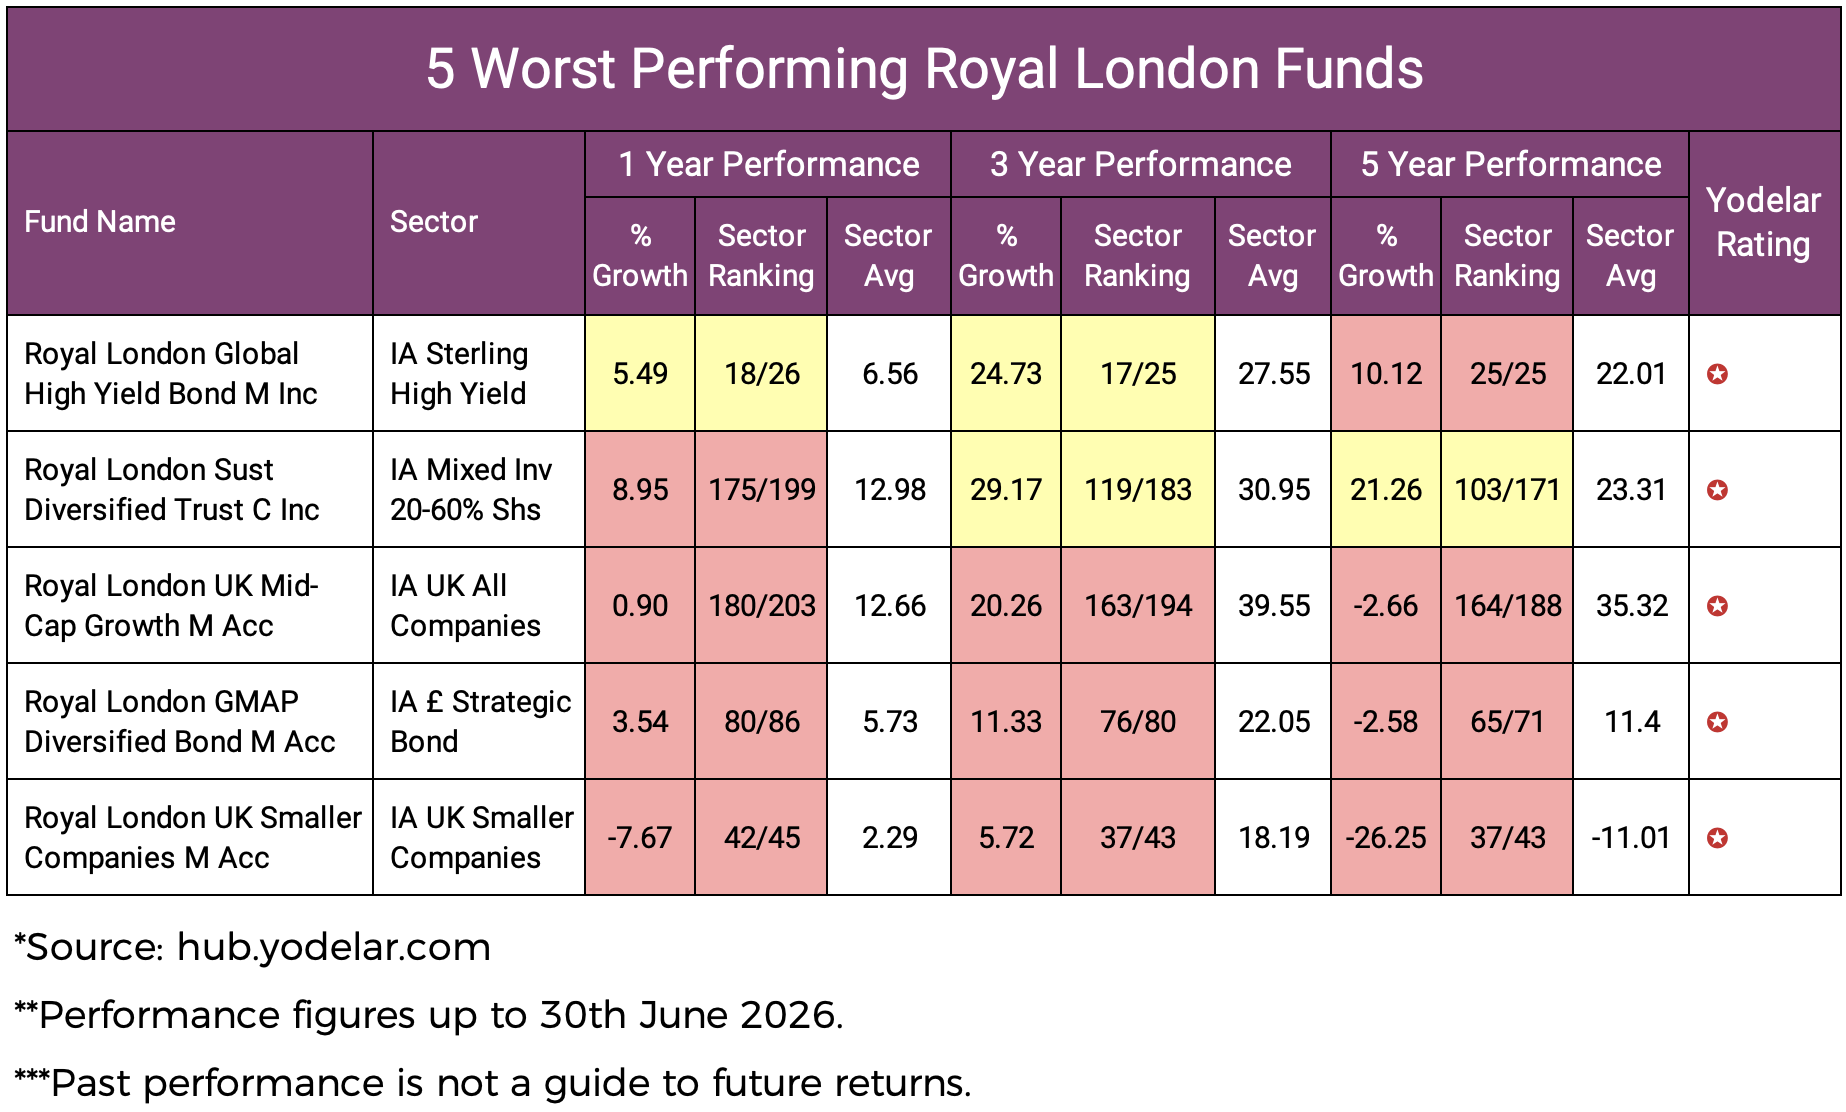
The weakest fund in this group was Royal London UK Smaller Companies, which fell 26.25% over 5 years and ranked 37th out of 43 funds in the IA UK Smaller Companies sector.
Royal London UK Mid-Cap Growth also struggled, returning -2.66% over 5 years and ranking 164th out of 188 funds in the IA UK All Companies sector.
The bond and mixed investment funds shown above also ranked poorly within their peer groups. These funds may have been held for risk control, income, diversification or another specific purpose, but their weaker sector rankings mean investors should be clear about why they remain in a portfolio.
A weak Yodelar Rating does not automatically mean a fund should be sold. It does mean the fund should not be ignored.
Why The Weaker Funds Matter
Many investors continue to hold funds because they were selected years ago, recommended in the past, or belong to a well-known provider. That can be a problem if the fund’s performance has weakened and the reason for holding it is no longer clear.
A fund can have a positive return and still perform poorly compared with other funds in the same IA sector. This is why the Royal London Global High Yield Bond fund is a useful example. Its 5-year return was positive at 10.12%, but it still ranked 25th out of 25 funds in its sector over that period.
For investors, that is the key point. Looking only at whether a fund has made money can give an incomplete picture. Sector ranking shows whether the fund has delivered a competitive result compared with other funds in the same IA sector.
If a fund has ranked poorly over several time periods, investors should understand whether there is still a strong reason for holding it.
What Royal London Investors Should Check
Investors holding Royal London funds should review the specific funds they own, rather than relying on the provider name.
|
Review question |
Why it matters |
|---|---|
|
How has each fund performed over 1, 3 and 5 years? |
This shows whether the fund has delivered competitive historic returns against sector peers. |
|
Where does each fund rank in its IA sector? |
A positive return may still be weak compared with competing funds in the same sector. |
|
What is the Yodelar Rating? |
This summarises historic sector-relative performance. |
|
Does the fund still have a clear role? |
Every holding should support the wider portfolio objective. |
|
Is there overlap with other funds? |
Several funds may provide similar exposure. |
|
Are charges justified? |
Costs should be considered alongside performance, risk and role. |
This type of review does not mean every weaker-rated fund should be replaced. There may be valid reasons for holding a specific fund, including tax position, risk management, income needs or wider portfolio balance.
However, investors should know which funds are supporting their portfolio and which may be holding it back.
Start With A Free Portfolio Analysis
Many investors hold Royal London funds alongside funds from other major providers without knowing how each holding compares with its sector peers.
Our free portfolio analysis reviews each fund individually, showing 1, 3 and 5-year performance, sector ranking and Yodelar Rating, where data is available. Yodelar Ratings are based on historic sector-relative performance and are not a guide to future returns.
The analysis can also help identify weaker-rated holdings, duplication, concentration, higher charges and funds that may no longer have a clear role.
Where appropriate, the analysis can also compare backdated portfolio performance with an MKC Invest model portfolio with a similar risk and investment style. This is a historic comparison only. It does not provide personal advice, is not a recommendation to invest in an MKC portfolio and should not be treated as a guide to future performance.
For investors, the analysis can help answer a simple question: are the funds held still earning their place?

Speak To An Adviser
For investors who want to understand whether their current portfolio remains suitable, a no obligation call with an adviser from our advice partner, MKC Wealth, can help.
The discussion can cover current holdings, portfolio analysis results, long-term objectives, time horizon and attitude to risk. It can also explain how a more structured investment approach may compare with the portfolio currently held.
Any personal recommendation would only be made after understanding the investor’s financial position, investment objectives, time horizon and attitude to risk. Any recommendation would include a clear explanation of risks, costs and ongoing service.

Summary
Royal London is a well-known investment brand, but the latest data shows why provider name alone is not enough.
The Royal London range reviewed included several strong funds. Royal London Asia Pacific ex Japan Equity Tilt ranked 1st in its sector over 5 years, while Royal London Global Equity Select and Royal London Global Equity Income also delivered strong sector-relative results.
However, the range also included funds with weaker records. Royal London UK Smaller Companies, Royal London UK Mid-Cap Growth, Royal London GMAP Diversified Bond and Royal London Global High Yield Bond all held 1 star Yodelar Ratings in this analysis.
That does not mean investors should favour or avoid Royal London funds as a group. It means each fund should be judged on its own evidence.
For investors, a practical step is to review the funds they actually hold, check how they rank against sector peers, and understand whether each one still supports the portfolio.