

-
Technology, emerging markets and Asia Pacific funds led all major sectors over the past year, with sector averages above 32%.
-
Funds focused on India averaged a loss of 8.16% over 12 months, the weakest of any IA sector.
-
Korea focused funds dominated the individual fund rankings, with several returning more than 150% in a year.
-
Bond sector weakness continued over 5 years, with the average UK Index Linked Gilts fund down 36.41% and the average UK Gilts fund down 17.88%.
-
The gap between the strongest and weakest sectors over 12 months was more than 40 percentage points, a reminder of how much sector exposure shapes portfolio outcomes.
Knowing what your portfolio is worth is one thing. Understanding whether its funds have performed well is another. A positive return can look reassuring, but how much does it tell you without knowing where your money was invested, how comparable funds performed and what risks were taken?
The latest figures reveal sharp contrasts. Technology and emerging market funds recorded substantial gains over the year to 30 September 2026, while India focused funds lost money. Elsewhere, some bond sectors were still showing losses over five years. These differences make a closer look worthwhile, not to chase the highest returns, but to understand the results of the investments you already own. Pasted markdown
Our review of 4,239 fund entries across 55 Investment Association (IA) sectors examines the highest and lowest returning areas of the market and the individual funds behind the headlines. It also explores the question that matters more than who topped the tables: what should these results prompt you to ask about your own portfolio?
The Strongest Sectors of the Past Year
Asia and emerging markets led the way. The table below shows the ten highest returning IA sectors by average 1 year fund performance, alongside their 3 and 5 year averages.
|
IA Sector |
1 Yr Avg Rtn |
3 Yr Avg Rtn |
5 Yr Avg Rtn |
|---|---|---|---|
|
Technology & Technology Innovation |
35.68% |
118.47% |
99.64% |
|
Global Emerging Markets |
32.81% |
73.19% |
52.05% |
|
Asia Pacific Excluding Japan |
32.17% |
71.51% |
53.46% |
|
Healthcare and Biotechnology |
29.11% |
29.52% |
21.63% |
|
Commodity/Natural Resources |
28.36% |
52.33% |
93.18% |
|
Asia Pacific Including Japan |
26.43% |
56.35% |
41.84% |
|
Japan |
25.86% |
60.65% |
49.49% |
|
Latin America |
21.82% |
36.18% |
59.24% |
|
North American Smaller Companies |
19.62% |
46.23% |
35.63% |
|
UK Equity Income |
17.58% |
50.86% |
57.81% |
*Source: hub.yodelar.com. Figures show average returns for funds in each sector over the stated periods, to 30th September 2026. Past performance is not a reliable indicator of future returns.
Technology funds extended their multi year lead, with the average fund in the sector up 118.47% over 3 years. But the more striking shift was the breadth of the Asia and emerging markets rally. The average Global Emerging Markets fund returned 32.81% in a year, more than double the 14.74% average of the much larger IA Global sector.
UK investors with portfolios concentrated in global and North American funds may be surprised by their relative position. The average North America fund returned 15.18% over the year, and the average Global fund 14.74%. Both are healthy returns in absolute terms, but they trailed most Asian and emerging market sectors by a wide margin.

The Weakest Sectors of the Past Year
At the other end of the table, the picture was dominated by India, China and European bond sectors.
|
IA Sector |
1 Yr Avg Rtn |
3 Yr Avg Rtn |
5 Yr Avg Rtn |
|---|---|---|---|
|
India/Indian Subcontinent |
-8.16% |
2.93% |
12.03% |
|
EUR Government Bond |
-3.35% |
6.27% |
-11.87% |
|
EUR Mixed Bond |
-3.01% |
6.56% |
-10.09% |
|
China/Greater China |
-2.76% |
26.51% |
-9.13% |
|
EUR Corporate Bond |
-1.66% |
11.16% |
-0.01% |
|
Global Government Bond |
-1.29% |
3.38% |
-9.60% |
|
Global Corporate Bond |
-0.45% |
11.82% |
1.22% |
|
USD Government Bond |
-0.07% |
2.50% |
1.18% |
|
Global Inflation Linked Bond |
0.16% |
6.91% |
-2.72% |
|
Global Mixed Bond |
0.23% |
8.91% |
3.35% |
*Source: hub.yodelar.com. Figures show average returns for funds in each sector over the stated periods, to 30th September 2026. Past performance is not a reliable indicator of future returns.
The reversal in India focused funds is one of the most notable stories in this year’s data. Having attracted substantial investor attention in recent years, the average fund in the sector lost 8.16% over the 12 months to 30th September 2026, during a period when the average emerging markets fund gained 32.81%.
For bond investors, the longer term picture remains difficult. Over 5 years, the average UK Index Linked Gilts fund has fallen 36.41% and the average UK Gilts fund 17.88%. The average Sterling Corporate Bond fund returned just 0.21% over the same 5 year period. These figures matter because bond funds are widely held in lower risk and retirement portfolios, where investors may not expect losses of this scale.
The Highest Returning Funds of the Past Year
The individual fund rankings were dominated by funds investing in a single market: South Korea.
|
Fund |
IA Sector |
1 Yr Growth |
3 Yr Growth |
5 Yr Growth |
Yodelar Rating |
|---|---|---|---|---|---|
|
iShares MSCI Korea UCITS ETF |
Specialist |
163.65% |
224.33% |
164.52% |
✪✪✪✪ |
|
Franklin FTSE Korea UCITS ETF |
Specialist |
161.71% |
224.17% |
167.53% |
✪✪✪✪ |
|
HSBC MSCI Korea Capped UCITS ETF |
Specialist |
157.11% |
217.25% |
158.53% |
✪✪✪✪ |
|
Xtrackers MSCI Korea UCITS ETF |
Specialist |
156.52% |
216.71% |
158.09% |
✪✪✪✪ |
|
Barings Korea Trust |
Specialist |
127.12% |
205.67% |
139.19% |
✪✪✪✪ |
*Source: hub.yodelar.com. Figures show average returns for funds in each sector over the stated periods, to 30th September 2026. Past performance is not a reliable indicator of future returns.
How Yodelar Rates Fund Performance
Taiwan focused funds also featured prominently, with several returning more than 95% over the year.
It is worth being clear about what these figures do and do not show. Single country funds of this kind sit in the IA Specialist sector and carry concentrated, country specific risk. A market capable of rising more than 150% in a year is also capable of falling sharply. The same ranking a few years ago would have shown a very different list, and investors who buy into a market after an exceptional rise have no assurance that it will continue.
The Lowest Returning Funds of the Past Year
|
Fund |
IA Sector |
1 Yr Growth |
5 Yr Growth |
Yodelar Rating |
|---|---|---|---|---|
|
HSBC MSCI Indonesia UCITS ETF |
Specialist |
-34.48% |
-34.61% |
✪ |
|
First Trust Dow Jones International Internet UCITS ETF |
Specialist |
-29.53% |
-32.46% |
✪ |
|
Redwheel China Equity |
China/Greater China |
-27.47% |
-40.36% |
✪ |
|
ARC TIME Freehold Income Authorised |
Direct and Hybrid Property |
-25.02% |
-30.73% |
✪ |
|
Comgest Growth China |
China/Greater China |
-20.04% |
-28.93% |
✪ |
*Source: hub.yodelar.com. Figures show average returns for funds in each sector over the stated periods, to 30th September 2026. Past performance is not a reliable indicator of future returns.
The presence of two China funds among the weakest performers reflects a difficult period for the sector as a whole, with the average China/Greater China fund down 2.76% over the year and down 9.13% over 5 years.

What This Means for Investors
The spread between the strongest and weakest sectors this year exceeded 40 percentage points. Two investors holding sensible looking, diversified fund lists could have had very different years depending simply on where their funds were invested.
Three points stand out from this quarter’s data:
Sector exposure, not fund selection alone, drove most of the difference in returns. An average fund in a strong sector comfortably beat an excellent fund in a weak one. Investors reviewing performance should always ask what their funds invest in before asking how well they were managed.
Market leadership rotated sharply. India, one of the strongest stories of recent years, was this year’s weakest sector. Korea, long overlooked by most UK portfolios, topped the tables. This year’s data illustrates how quickly leadership can change, and why basing investment decisions on whichever market has most recently risen carries its own risks.
Bond allocations deserve attention. Many investors hold bond funds to reduce risk. The 5 year figures show that some bond sectors have delivered losses that investors in lower risk portfolios may not have anticipated. Understanding what a bond allocation holds, and why, is as important as reviewing the equity side of a portfolio.
None of this tells any individual investor what to buy or sell. It does, however, show the value of knowing how each fund in a portfolio has performed relative to its own sector, and how the portfolio’s overall sector exposure is positioned.
How Have Your Funds Performed?
Most portfolio statements show whether a portfolio has grown. Far fewer show how each fund compares with the alternatives available in the same sector.
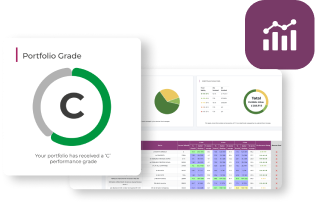
Yodelar’s free portfolio analysis provides a factual review of the funds you currently hold. Where sufficient performance history is available, it shows each fund’s 1, 3 and 5 year performance, its ranking within the relevant IA sector, the sector average return, its historic Yodelar performance rating, and an overall portfolio performance grade.
Yodelar Ratings are based on historic sector-relative performance. They do not assess personal suitability, are not a recommendation, and should not be treated as a guide to future returns.
The service is free, and there is no obligation to make changes or proceed with financial advice.

Speak to a Regulated Adviser
Performance data can identify important questions, but it cannot establish whether your current arrangements remain personally suitable, or whether your portfolio’s sector exposure matches your objectives and attitude to risk.
UK-based investors can book a no-obligation call with an FCA-authorised financial adviser from our advice partner, MKC Wealth, to discuss their portfolio alongside their objectives, investment period and attitude to risk.
Any personal recommendation would only be made after the adviser had considered your financial position, objectives, investment period, attitude to risk and ability to withstand investment losses. The risks, costs and ongoing services associated with any recommendation would also be clearly explained.

Summary
The 12 months to 30th September 2026 rewarded investors with exposure to Asia, emerging markets and technology, while India focused funds, China funds and much of the bond market struggled. Over 5 years, several bond sectors remain in negative territory.
Sharp rotations of this kind are a normal feature of markets, and no sector leads indefinitely. The practical lesson is not to chase whichever market has just risen, but to understand where your portfolio is invested, how each holding has performed against comparable funds, and whether the overall balance still reflects the level of risk you intend to take.

Important Risk Warning
This article is for information only and does not constitute personal financial advice or a recommendation to buy, sell or switch any investment.
Past performance is not a reliable indicator of future performance. Yodelar Ratings are based on historic performance compared with funds in the same Investment Association sector. They do not assess personal suitability and should not be treated as a guide to future returns.
The value of investments and any income from them can fall as well as rise. Investors could get back less than they invest. Anyone who is unsure whether an investment or portfolio is suitable for them should seek personal advice from an FCA-authorised financial adviser.