

-
10 of the 81 Fidelity funds analysed (12.3%) achieved a top performing 4 or 5 star Yodelar rating.
-
53 funds (65.4%) received a 1 or 2 star rating, having ranked in the weaker half of their sectors across the periods measured.
-
7 Fidelity funds ranked in the top quartile of their sectors over all of the 1, 3 and 5 year periods, including Fidelity Special Situations, Fidelity Japan and Fidelity Index US.
-
Several of Fidelity’s strongest performers were its low cost index funds, while a number of well known active funds ranked in the bottom half of their sectors.
Fidelity is one of the most widely held fund brands in the UK. Its range spans low cost index trackers, flagship active funds such as Fidelity Special Situations, multi asset portfolios and a broad selection of regional and bond funds, and its funds appear in retail portfolios, workplace pensions and adviser recommendations across the country.
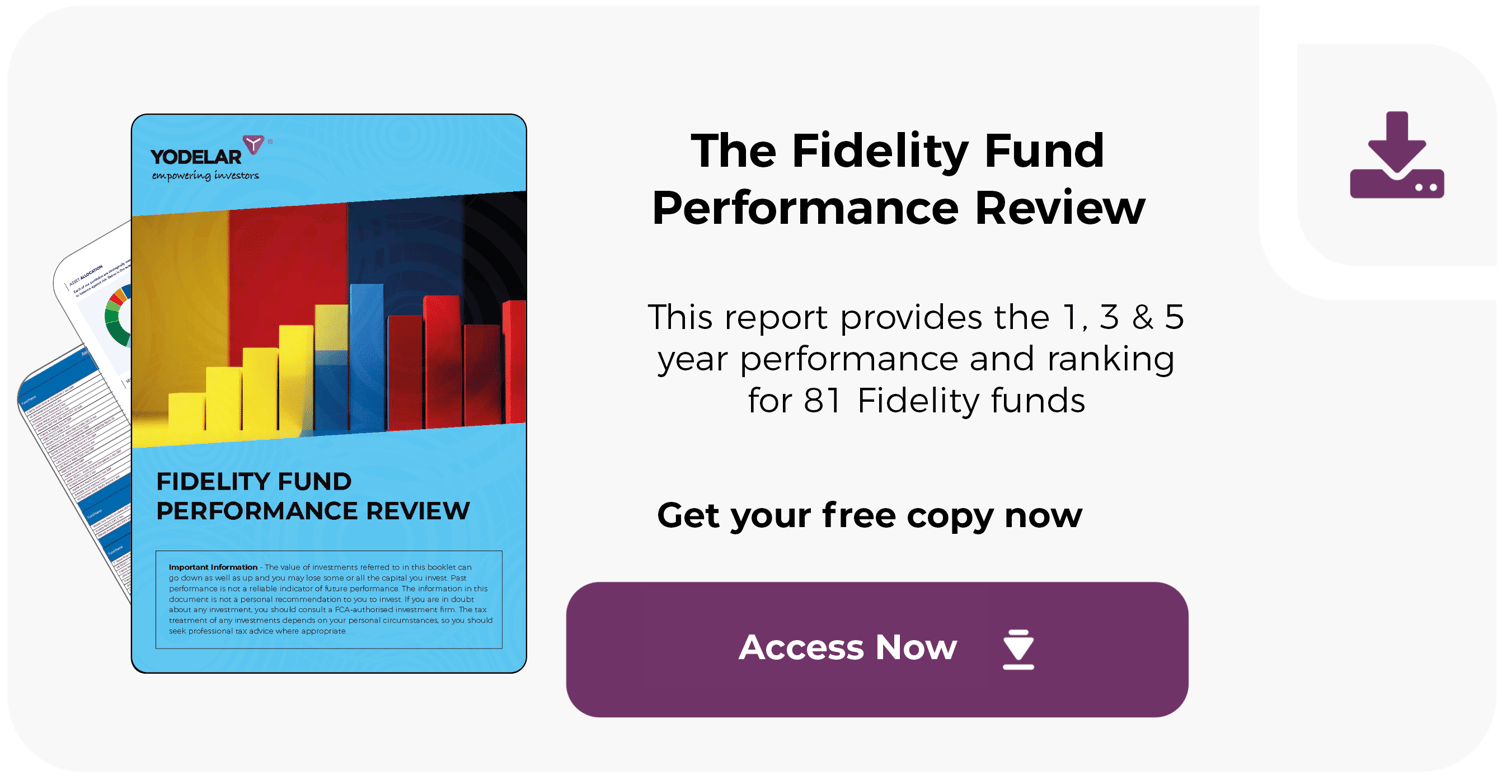
But a familiar brand name tells investors little about how the individual funds within a range have actually performed. Our latest review analyses 81 Fidelity funds across the Investment Association universe, using performance data to 30th September 2026, to identify which funds have delivered for investors relative to their sectors, and which have struggled.
How Fidelity’s Range Rated Overall
|
Yodelar Rating |
Number of Funds |
% of Range |
|---|---|---|
|
✪✪✪✪✪ |
6 |
7.4% |
|
✪✪✪✪ |
4 |
4.9% |
|
✪✪✪ |
18 |
22.2% |
|
✪✪ |
22 |
27.2% |
| ✪ | 31 | 38.3% |
*Source: hub.yodelar.com. Based on 81 Fidelity funds rated on historic sector-relative performance to 30th September 2026. Yodelar Ratings do not assess personal suitability, are not a recommendation, and should not be treated as a guide to future returns.
How Yodelar Rates Fund Performance
For comparison, across the full universe of 4,239 funds we analysed, 17.7% achieved a 4 or 5 star rating and 61.7% received 1 or 2 stars. Fidelity’s range therefore rated slightly below the wider market on this measure, with a smaller proportion of top rated funds. As with any large range, however, the overall distribution conceals funds with consistently strong sector rankings alongside a long tail of weaker ones.
Fidelity’s Top Performing Funds
The highest ranked funds in Fidelity’s range combined strong returns with consistently high sector rankings across 1, 3 and 5 years.
|
Fund |
IA Sector |
1 Yr |
3 Yr |
5 Yr |
5 Yr Rank |
Yodelar Rating |
|---|---|---|---|---|---|---|
|
Fidelity US Equity Research Enhanced UCITS ETF |
North America |
19.06% |
73.47% |
93.03% |
21/212 |
✪✪✪✪ |
|
Fidelity Index US |
North America |
19.06% |
71.85% |
91.00% |
34/212 |
✪✪✪✪✪ |
|
Fidelity Japan |
Japan |
30.31% |
72.27% |
87.60% |
10/89 |
✪✪✪✪✪ |
|
Fidelity Index World |
Global |
18.79% |
67.39% |
79.36% |
75/428 |
✪✪✪✪ |
|
Fidelity Special Situations |
UK All Companies |
21.88% |
72.84% |
77.37% |
21/188 |
✪✪✪✪✪ |
|
Fidelity Index UK |
UK All Companies |
19.18% |
55.53% |
69.79% |
41/188 |
✪✪✪✪✪ |
*Source: hub.yodelar.com. Figures show average returns for funds in each sector over the stated periods, to 30th September 2026. Past performance is not a reliable indicator of future returns.
Seven Fidelity funds achieved the most demanding consistency measure in our analysis, ranking in the top quartile of their sector over all of the 1, 3 and 5 year periods: Fidelity Special Situations, Fidelity Japan, Fidelity Index US, Fidelity Index UK, Fidelity US Equity Research Enhanced ETF, Fidelity Greater China and the Fidelity Emerging Markets Quality Income ETF.
Two things stand out from this list.
The first is the strength of Fidelity’s active UK and Japan funds. Fidelity Special Situations returned 77.37% over 5 years, ranking 21st of 188 funds in the IA UK All Companies sector, with top quartile rankings over 1, 3 and 5 years. Fidelity Japan ranked 10th of 89 funds in its sector over 5 years.
The second is the sector-relative record of Fidelity’s index range. Fidelity Index US, Fidelity Index UK and Fidelity Index World all earned 4 or 5 star ratings, with the Index World fund returning 79.36% over 5 years at an ongoing charge of just 0.12%. These funds simply track their markets, but because a large proportion of active funds in those sectors ranked below them, their sector-relative record has been strong.

Where Fidelity’s Range Has Struggled
A number of Fidelity funds ranked persistently in the lower half of their sectors.
|
Fund |
IA Sector |
1 Yr (Rank) |
5 Yr (Rank) |
Yodelar Rating |
|---|---|---|---|---|
|
Fidelity American |
North America |
9.20% (199/260) |
42.14% (175/212) |
✪ |
|
Fidelity European |
Europe Excluding UK |
10.08% (103/137) |
43.29% (88/131) |
✪ |
|
Fidelity UK Opportunities |
UK All Companies |
4.51% (181/200) |
-13.24% (180/188) |
✪ |
|
Fidelity Asian Smaller Companies |
Asia Pacific Excluding Japan |
4.83% (102/106) |
37.81% (67/99) |
✪ |
|
Fidelity Global Dividend |
Global Equity Income |
12.34% (47/59) |
64.37% (28/51) |
✪✪ |
|
Fidelity China |
China/Greater China |
-10.98% (44/61) |
-25.65% (50/55) |
✪ |
*Source: hub.yodelar.com. Figures show average returns for funds in each sector over the stated periods, to 30th September 2026. Past performance is not a reliable indicator of future returns.
Context matters when interpreting these figures, and it cuts both ways.
Some weak absolute returns largely reflect weak sectors. Fidelity China’s 25.65% loss over 5 years came in a sector where the average fund lost 9.13%, so the sector environment explains part, though not all, of the outcome. Similarly, the Fidelity Index Linked Bond fund’s 46.78% fall over 5 years occurred in a sector, UK Index Linked Gilts, where the average fund fell 36.41%. Investors in these funds have experienced losses, but a substantial portion of those losses would have applied to most funds in the same sector.
Other results are harder to attribute to the sector. Fidelity American returned 42.14% over 5 years in a sector that averaged 67.24%, ranking 175th of 212 funds. Fidelity UK Opportunities lost 13.24% over 5 years while the average fund in its sector gained 38.93%. Fidelity Asian Smaller Companies ranked 102nd of 106 funds in its sector over the past year. For holdings such as these, the relevant question for investors is not whether the fund might recover, which nobody can know, but whether there is a clear, current reason for continuing to hold it rather than the alternatives available.
It is also worth noting that a weak sector ranking is not by itself proof that a fund should be sold. A fund may be managed with a deliberately different risk profile or style from its sector peers, and ranking tables cannot capture that. What investors should expect is an explanation.

What This Means for Fidelity Investors
Fidelity’s range illustrates a pattern we see across most large fund groups: consistently high-ranking funds and persistent laggards existing side by side under the same brand.
An investor who holds Fidelity funds cannot draw any conclusion from the brand alone. The gap between the strongest and weakest Fidelity funds in the same broad asset class ran to more than 50 percentage points over 5 years. Within this one provider’s range, fund selection made more difference than the decision to invest with the provider at all.
For investors who hold Fidelity funds, three questions follow directly from the data:
- How does each Fidelity fund you hold rank within its IA sector over 1, 3 and 5 years?
- Where a fund has ranked in the bottom half across all three periods, what is the current reason for holding it?
- If you hold several funds from one provider, how much overlap exists between them, and is the overall balance deliberate?
How Do Your Funds Compare?
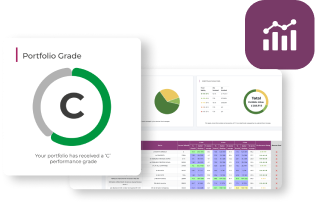
Whether your portfolio holds Fidelity funds or those of any other provider, Yodelar’s free portfolio analysis shows how each of your funds has performed and ranked. Where sufficient performance history is available, it provides each fund’s 1, 3 and 5 year performance, its ranking within the relevant IA sector, the sector average return, its historic Yodelar performance rating, the proportion of your portfolio held in each rating band, and an overall portfolio performance grade.
Yodelar Ratings are based on historic sector-relative performance. They do not assess personal suitability, are not a recommendation, and should not be treated as a guide to future returns.
The service is free, and there is no obligation to make changes or proceed with financial advice.

Speak to a Regulated Adviser
Performance rankings can identify questions, but they cannot determine whether a fund or portfolio is personally suitable, whether a change would create tax consequences, or what role each holding should play in your wider plans.
UK-based investors can book a no-obligation call with an FCA-authorised financial adviser from our advice partner, MKC Wealth, to discuss their portfolio alongside their objectives, investment period and attitude to risk. Any personal recommendation would only be made after the adviser had considered your financial position, objectives, investment period, attitude to risk and ability to withstand investment losses, with the risks, costs and ongoing services clearly explained.

Summary
Fidelity’s range contains some of the most consistently high-ranking funds in our latest analysis, including Fidelity Special Situations, Fidelity Japan and its core index funds, each of which ranked in the top quartile of its sector over 1, 3 and 5 years. It also contains a substantial number of funds that have ranked persistently in the weaker half of their sectors, with 65.4% of the range rated 1 or 2 stars.
The lesson is not specific to Fidelity. No fund group, however large or well resourced, performs uniformly well, and holding funds from a respected brand is no substitute for knowing how each individual fund has performed against its peers and why it sits in your portfolio.

Important Risk Warning
This article is for information only and does not constitute personal financial advice or a recommendation to buy, sell or switch any investment.
Past performance is not a reliable indicator of future performance. Yodelar Ratings are based on historic performance compared with funds in the same Investment Association sector. They do not assess personal suitability and should not be treated as a guide to future returns.
The value of investments and any income from them can fall as well as rise. Investors could get back less than they invest. Anyone who is unsure whether an investment or portfolio is suitable for them should seek personal advice from an FCA-authorised financial adviser.