


-
The IA Commodity and Natural Resources sector was the strongest performer over six months, delivering an average return of 36.16%, the highest among the 55 sectors analysed.
-
The IA Latin America sector followed closely with 33.78% growth over six months, also recording a strong 19.41% return over three months.
-
The IA India / Indian Subcontinent sector was the weakest over six months, declining -9.75%, despite posting gains of 11.10% over three months and 6.12% over one month.
-
The IA North America sector remained positive over six months at 6.00%, but recorded declines of -0.35% over one month and -0.68% over three months.
-
All 10 featured funds outperformed their respective sector averages over the past 1, 3 and 6 months, ranking within the higher positions of their sectors across each period analysed.
The past six months have produced a noticeable change in where returns have been generated across investment markets. Performance has varied widely between sectors and regions, with some areas delivering strong gains while others have been more subdued.
Commodities and emerging markets have recorded some of the highest average returns, while sectors such as North America and Technology have experienced more mixed results. This divergence highlights how returns can differ significantly across the 55 Investment Association (IA) sectors over relatively short periods.
In this article, we review sector performance over the past 1, 3 and 6 months and identify 10 funds that have ranked strongly within their sectors across these periods. Each fund has delivered returns above its sector average over the timeframes analysed.
While long-term investing remains central to achieving financial objectives, reviewing short-term performance can provide useful context on how different areas of the market have recently performed.

Sector performance over the past 6 months
The past six months have clearly demonstrated the importance of sector allocation during periods of market volatility. Returns have varied widely, reflecting differing sensitivities to inflation, interest rates and global growth conditions.
The table below shows the 55 IA sectors, with average returns over the past 1, 3 and 6 months.
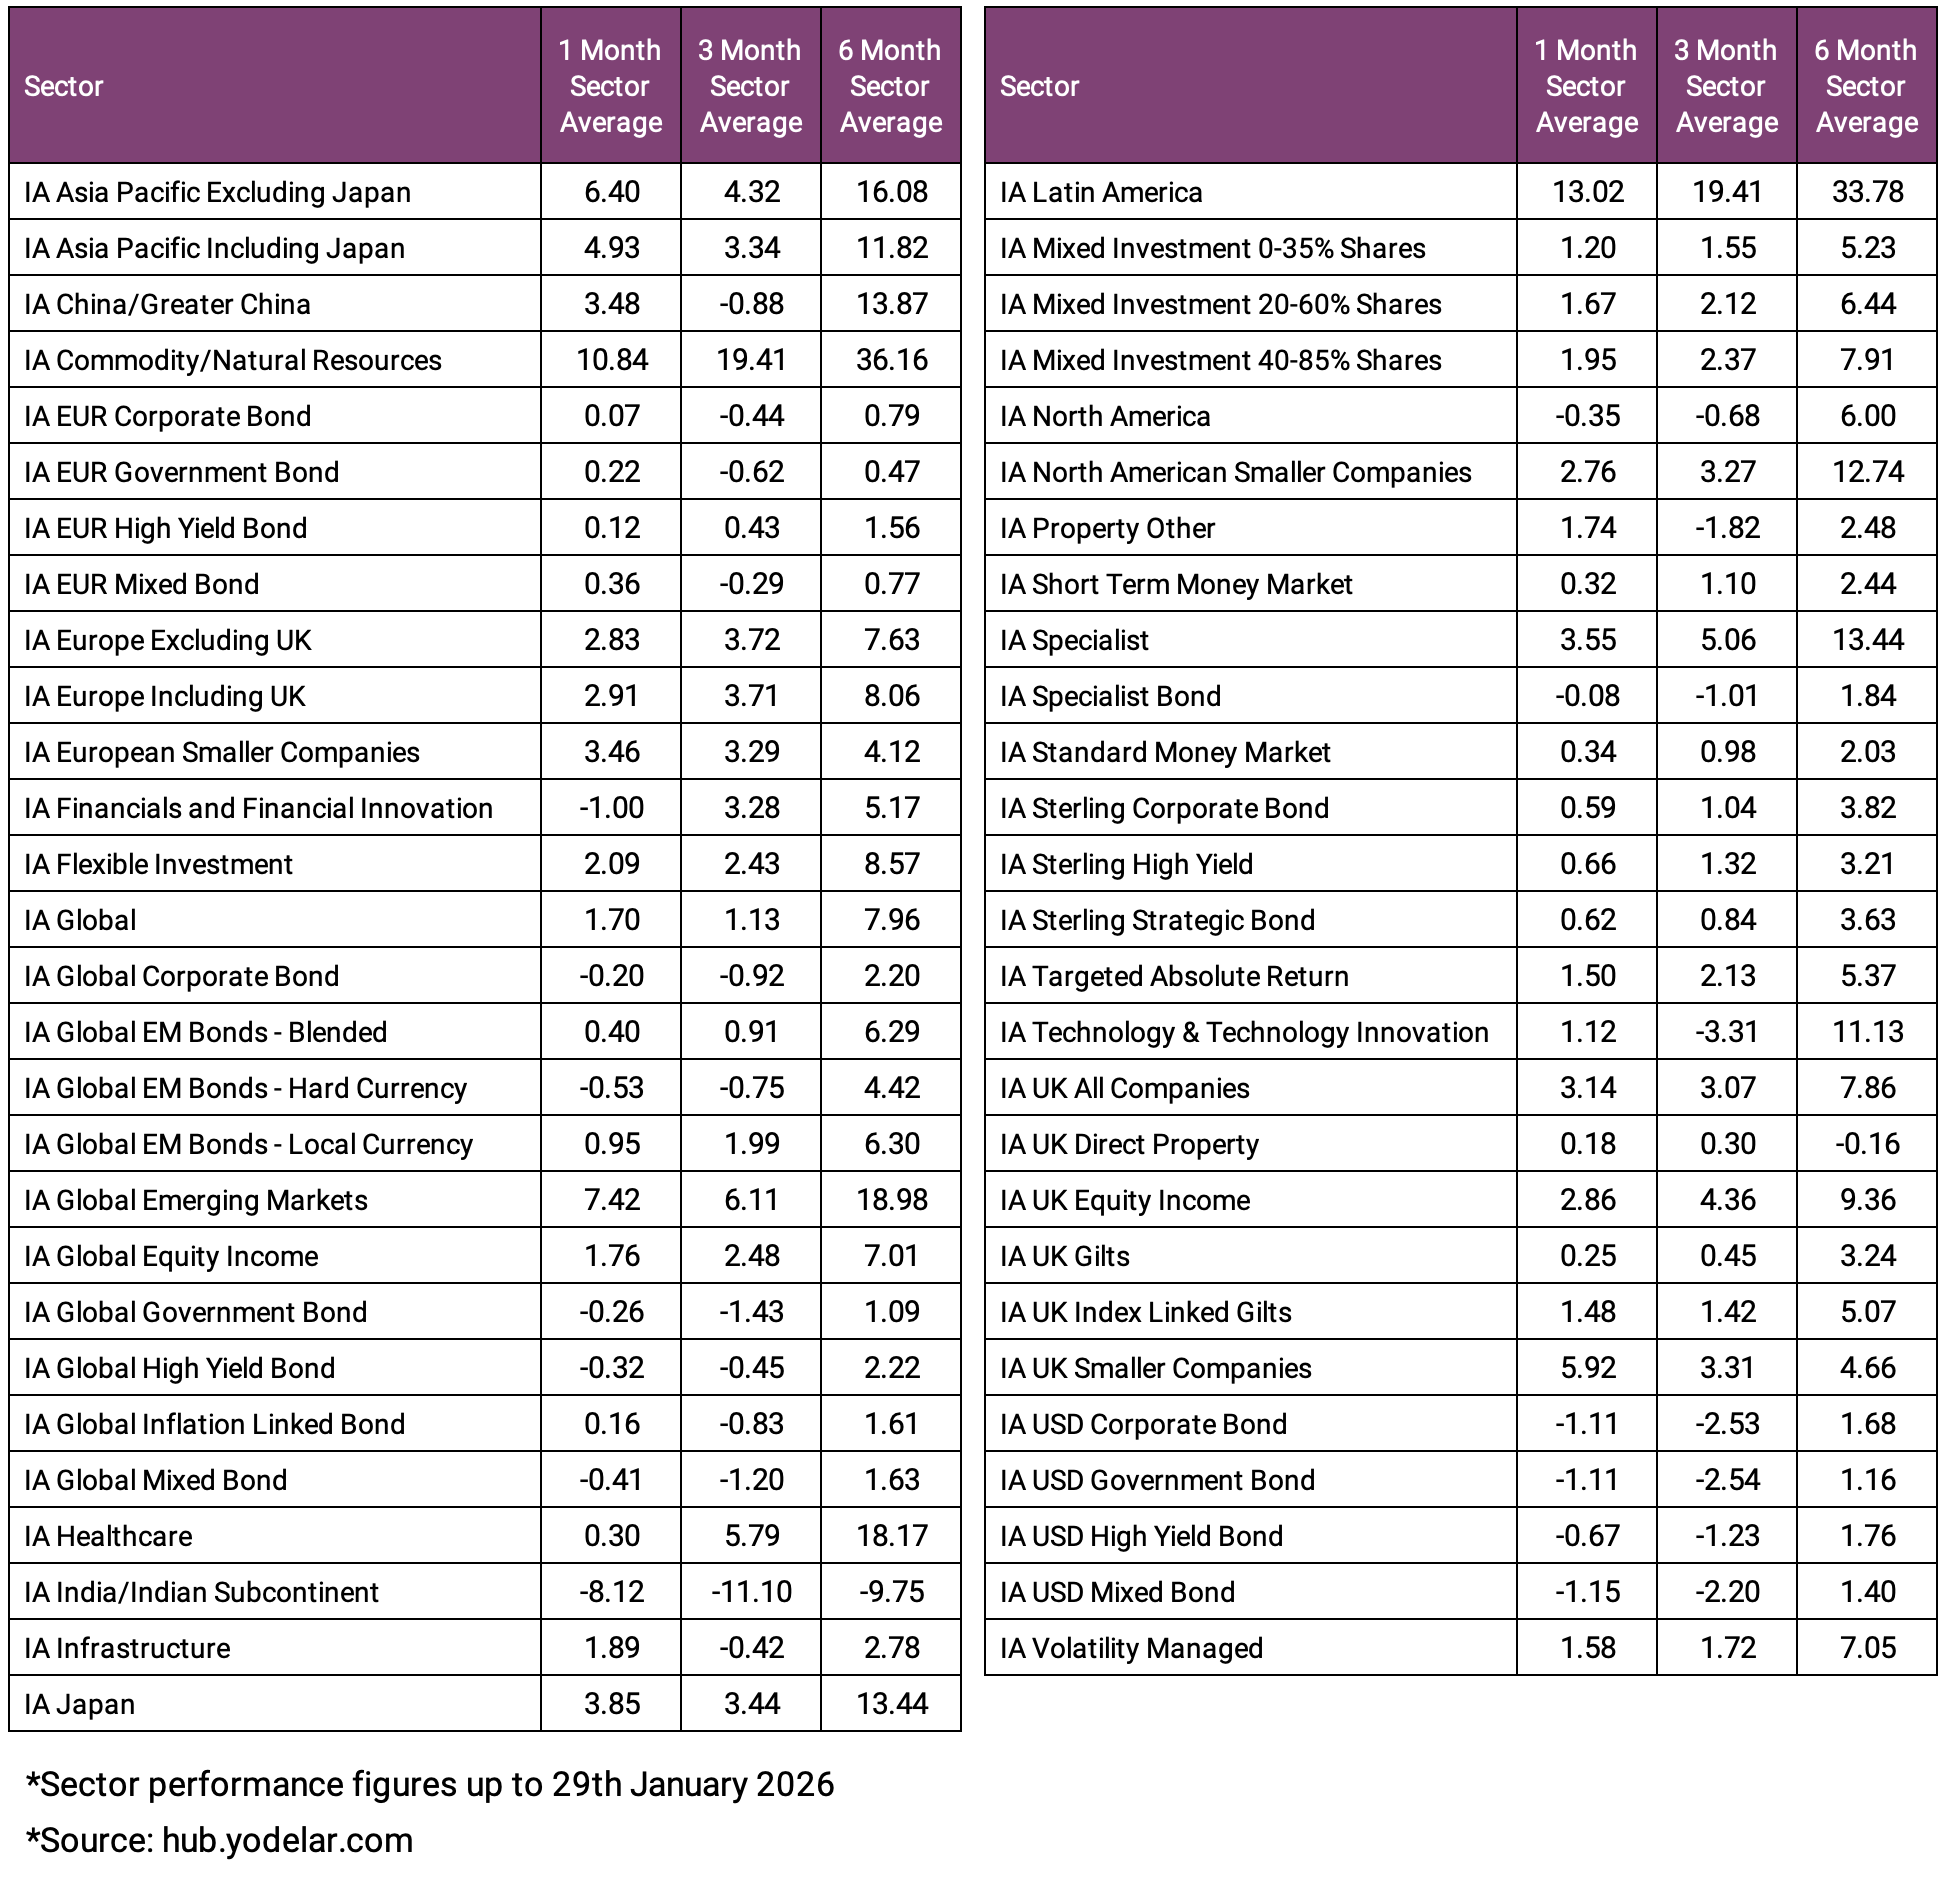
Strongly Performing Sectors
Several sectors have delivered notably strong average returns over the past six months.
The IA Commodity and Natural Resources sector has been the strongest performer, returning 36.16% over six months. This follows gains of 19.41% over three months and 10.84% over one month, indicating strength across all three periods analysed.
The IA Latin America sector has also produced high returns, rising 33.78% over six months and 19.41% over three months. Shorter-term performance has remained positive, placing it among the stronger regional sectors over the period reviewed.
The IA Global Emerging Markets sector returned 18.98% over six months, alongside gains of 7.42% over one month and 6.11% over three months. This places it comfortably above many developed market sectors over the same timeframe.
The IA Healthcare sector rose 18.17% over six months, with additional gains of 5.79% over three months and 0.30% over one month. While not as strong as commodities or Latin America, it has delivered steady positive returns across all three periods.

Weaker-Performing Sectors
In contrast, several sectors have delivered weaker or more mixed results.
The IA India / Indian Subcontinent sector recorded a six-month return of -9.75%, making it the weakest sector over that timeframe. However, shorter-term returns have been positive, with gains of 11.10% over three months and 6.12% over one month.
The IA UK Direct Property sector returned -0.16% over six months. Returns over one and three months were modest at 0.18% and 0.30% respectively, indicating limited movement over the period.
The IA North America sector remains up 6.00% over six months but has recorded declines of -0.35% over one month and -0.68% over three months, suggesting more subdued recent performance compared with earlier in the period.
The IA Technology and Technology Innovation sector gained 11.13% over six months but fell 3.31% over three months before recovering slightly with a 1.12% gain over one month.
Bond sectors have generally produced low or marginally positive returns over six months, placing them behind most equity sectors in this review.
Overall, the six-month period has seen a clear difference between the strongest and weakest sectors, with returns varying significantly across asset classes.
Top Performing Funds Over The Past 6 Months
Below are 10 of the highest-ranking funds over the past 1, 3 and 6 months, shown alongside their respective sectors. Each fund has not only outperformed its sector average across the periods analysed, but has also ranked among the top performers within its sector during each timeframe.

iShares MSCI South Africa UCITS ETF – IA Specialist
This ETF invests in companies based in South Africa. Over the past year it delivered growth of 80.83%, ranking 15th out of 242 funds in the IA Specialist sector, compared with a sector average return of 22.12%. Six-month growth of 50.44% (14/247) and three-month growth of 27.22% (9/247) were also well ahead of the sector averages of 13.44% and 5.06%.
The fund has high exposure to mining and banking companies, which means returns are strongly influenced by commodity prices and domestic economic conditions. Because it focuses on a single country, performance can move more sharply than funds that invest across several regions.
Robeco Emerging Stars Equities – IA Global Emerging Markets
This fund invests in companies across emerging market countries. It delivered 45.89% growth over one year, ranking 3rd out of 176 funds in its sector, compared with a sector average of 28.38%. Six-month growth of 26.55% (13/182) and three-month growth of 9.22% (31/182) were also above the sector average.
A large portion of the portfolio is invested in Korea, China and Taiwan, with significant exposure to financial and technology companies. Emerging markets can experience larger swings in performance due to economic and currency changes.
T. Rowe Price China Evolution Equity A – IA China / Greater China
This fund focuses on companies based in China. Over one year it returned 35.35%, ranking 8th out of 64 funds in the sector, compared with a sector average of 26.02%. It ranked 2nd out of 65 over three months with growth of 8.82%, while the sector average fell by 0.88%, and ranked 7th over six months with growth of 25.81%.
The portfolio includes a mix of industrial, technology and consumer companies. As it invests in a single country, returns can be more volatile than funds spread across multiple regions.

Vanguard Global Emerging Markets A Acc – IA Global Emerging Markets
This fund invests across a wide range of emerging market countries. It delivered 36.89% growth over one year, ranking 28th out of 176 funds, compared with a sector average of 28.38%. It also outperformed the sector average over six months with 25.43% growth (22/182) and over three months with 10.99% growth (12/182).
The portfolio is spread across countries including China, Korea, Taiwan and Brazil, with strong exposure to technology and financial companies. Its broader spread across regions may reduce reliance on any single country.
Artemis SmartGARP Global Emerging Markets Equity – IA Global Emerging Markets
This fund invests in companies across emerging markets, focusing on businesses considered attractively valued. It delivered 36.50% growth over one year, ranking 31st out of 176 funds and ahead of the sector average of 28.38%. It also exceeded the sector average over six months with 24.27% growth (34/182) and over three months with 9.73% growth (25/182).
The portfolio is mainly invested in China, Korea, Taiwan and Brazil, with notable exposure to financial, materials and technology companies. Returns may vary depending on economic conditions across these regions.
Artemis Global Income I – IA Global Equity Income
This fund invests in dividend-paying companies around the world. It ranked 1st out of 56 funds over one year with growth of 50.97%, compared with a sector average of 10.85%. It also ranked 1st over six months (24.27%), three months (14.64%) and one month (8.99%), outperforming the sector average in each period.
The portfolio includes companies from North America, Europe and emerging markets, with a large allocation to financial businesses. Income-focused funds can perform differently depending on whether markets favour dividend-paying shares or faster-growing companies.
WS Morant Wright Nippon Yield B Acc – IA Japan
This fund invests in Japanese companies. It delivered 38.97% growth over one year, ranking 2nd out of 97 funds in the IA Japan sector, compared with a sector average of 19.96%. It also ranked 2nd over six months with 23.98% growth and 2nd over three months with 11.99%.
The portfolio includes a strong weighting to financial, industrial and materials companies. As a single-country fund, performance is closely linked to economic and currency movements in Japan.
Orbis Global Equity Standard – IA Global
This fund invests in companies across developed and emerging markets. Over one year it delivered 32.41% growth, ranking 25th out of 542 funds in the IA Global sector, compared with a sector average of 9.72%. It also outperformed the sector average over six months with 19.25% growth (37/555) and over three months with 6.87% growth (43/557).
The portfolio includes investments in the United States, emerging markets and the United Kingdom, with exposure across healthcare, industrial and financial companies. Differences in regional allocation can lead to periods of stronger or weaker performance compared with the wider sector.
Invesco FTSE RAFI UK 100 UCITS ETF – IA UK All Companies
This ETF invests in large UK companies using a rules-based approach. It delivered 31.39% growth over one year, ranking 5th out of 206 funds in the sector, compared with a sector average of 16.29%. It also ranked 2nd over six months with 18.30% growth and 3rd over three months with 10.18%.
The portfolio has significant exposure to financial, energy and materials companies. Returns in the UK market can be influenced by commodity prices and domestic economic conditions.
Dimensional UK Value Acc – IA UK All Companies
This fund invests mainly in UK companies considered attractively valued. It delivered 36.34% growth over one year, ranking 2nd out of 206 funds in the sector, compared with a sector average of 16.29%. Over six months it returned 18.29% (3/208) and over three months 10.36% (2/208), consistently ahead of the sector average.
The portfolio has a strong weighting to financial, energy and materials companies. Value-focused funds can experience periods of both strong and weaker performance depending on market conditions.
Conclusion
The past six months have underlined the importance of diversification and sector awareness. The strongest returns have come from commodities, emerging markets and value-focused strategies, while other areas of the market have delivered more modest or uneven results. The gap between higher and lower performing sectors has been significant.
The 10 funds featured in this article have each outperformed their sector averages over the past 1, 3 and 6 months, ranking consistently within the higher positions of their respective sectors. That consistency is notable. However, short-term performance alone should not determine investment decisions.
Recent results can help highlight developing trends and changing conditions across markets. These insights are most useful when viewed alongside long-term objectives, risk levels and overall portfolio structure. Maintaining a diversified and structured approach remains key to supporting long-term financial plans.

Portfolio Analysis: A Disciplined Approach to Long-Term Success
Market conditions evolve over time. As sectors rise and fall, portfolios can gradually become more concentrated in certain regions or styles without investors fully realising it. What began as a balanced structure can shift simply due to differences in performance.
Regular portfolio analysis helps identify these changes. It highlights where exposure may have increased, where risk may have drifted, and whether the overall structure still reflects the original investment objectives.
Taking a proactive approach is not about reacting to short-term movements or following recent winners. It is about ensuring each holding continues to serve a clear purpose within the portfolio. Over time, maintaining balance, managing exposure and reviewing performance against sector averages can have a greater influence on outcomes than any single short-term market move.
A comprehensive portfolio review provides clarity on how investments are positioned beneath the surface. It can identify concentration risk, duplication across funds and areas where performance has consistently lagged sector averages. This evidence-based approach supports informed decision-making and helps ensure portfolios remain aligned with long-term goals.


