


- We analysed 7,071 exchange-traded funds, reviewing sector rankings and returns across the 1, 3 and 5-year periods analysed.
- Only 11.1% of ETFs achieved a 4 or 5-star Yodelar rating, highlighting how rare consistent sector outperformance is.
- 67.5% of ETFs received a 1 or 2-star rating, meaning returns fell below their sector averages across multiple timeframes.
- Strong performance was concentrated in a small number of ETFs across financials, commodities, technology, Japan and Latin America sectors.
Exchange-traded funds are widely used by investors seeking efficient access to markets. Because many ETFs track an index, they are often viewed as straightforward tools that deliver similar outcomes within the same sector.
The data shows that outcomes can differ more than expected.
To assess performance properly, we analysed 7,071 exchange-traded funds and reviewed their returns and sector rankings over the 1, 3 and 5-year periods analysed. Each ETF was assessed against others within its Investment Association sector and assigned a Yodelar rating based on relative performance.
The results highlight a clear pattern: consistent sector outperformance is uncommon, even among passively managed products.

ETF Performance Summary
Of the 7,071 ETFs analysed:
- 787 ETFs, or 11.1%, achieved a 4 or 5-star Yodelar rating based on sustained relative performance.
- 4,767 ETFs, or 67.5%, received a 1 or 2-star rating, indicating returns below their sector averages across multiple periods analysed.
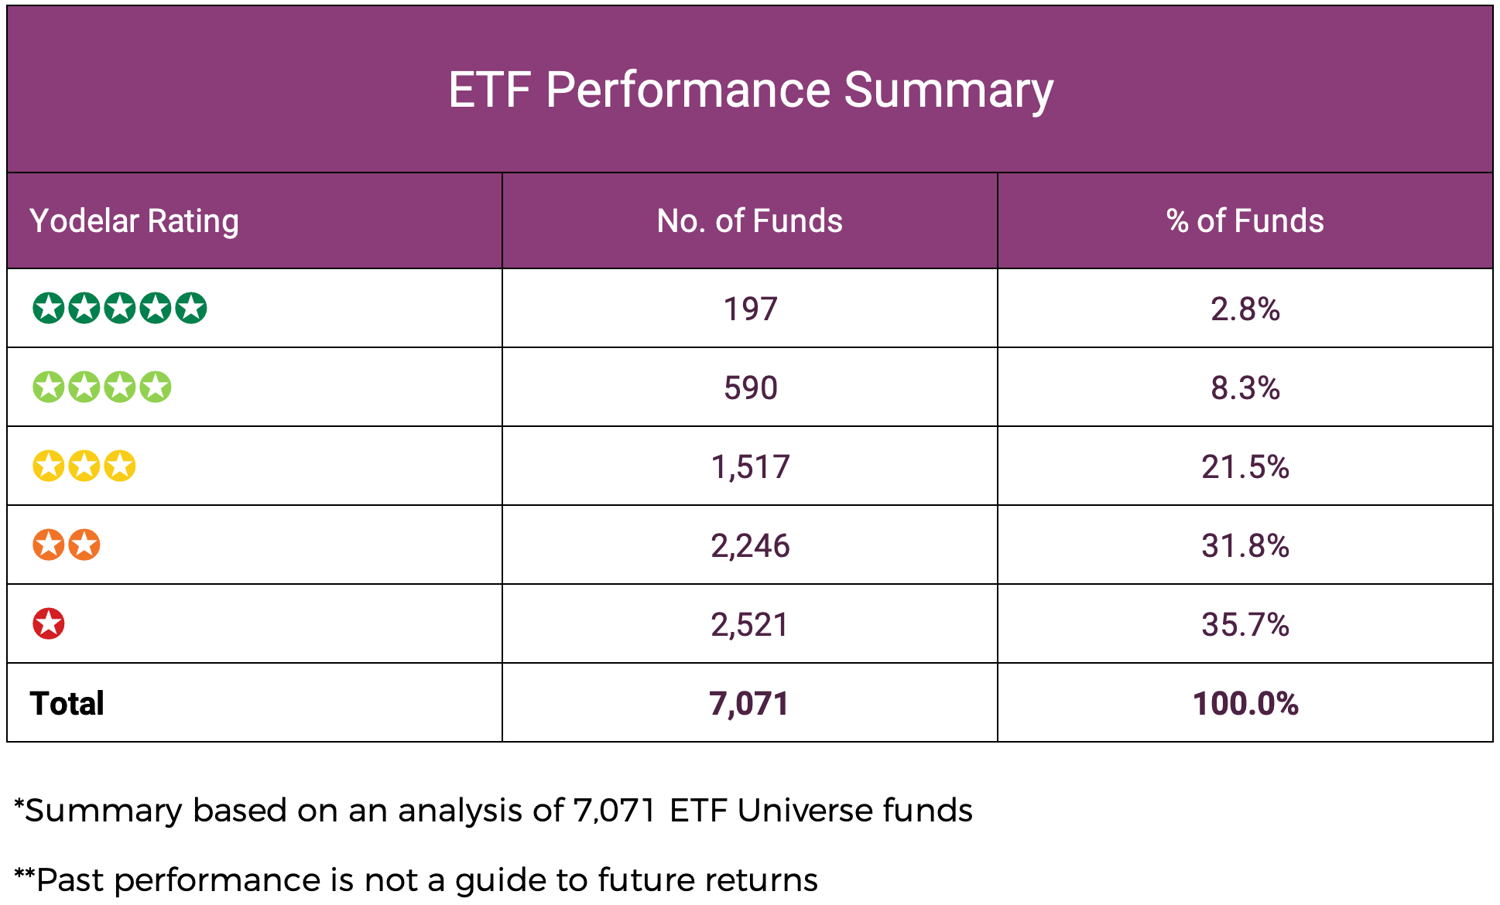
This distribution reinforces an important point. While ETFs are often associated with low cost and transparency, relative performance within sectors varies widely. Differences in indexes, weighting methodology and sector exposure can all influence outcomes.
What Are ETFs?
An exchange-traded fund, or ETF, is a fund that holds a group of investments such as shares, bonds or commodities. Instead of buying each investment individually, investors can buy one ETF to gain exposure to that wider market.
ETFs are traded on a stock exchange, meaning they can be bought and sold during market hours in the same way as company shares. Most ETFs aim to track the performance of a specific index or defined market area, such as US equities, UK shares, global bonds or commodities.
Because they typically follow an index rather than being actively managed, ETFs often have lower ongoing charges than many traditional funds. They are also generally transparent about what they hold, with portfolio details published regularly.
However, ETFs that appear similar can still produce different results. Variations in index construction, weighting methods and regional exposure can all affect performance. For this reason, reviewing how an ETF compares with others in its sector remains important when assessing long-term efficiency.
10 ETFs That Ranked Highly Over 1, 3 and 5 Years
The ETFs below ranked above their sector averages across the 1, 3 and 5-year periods analysed and achieved a 5-star Yodelar rating.
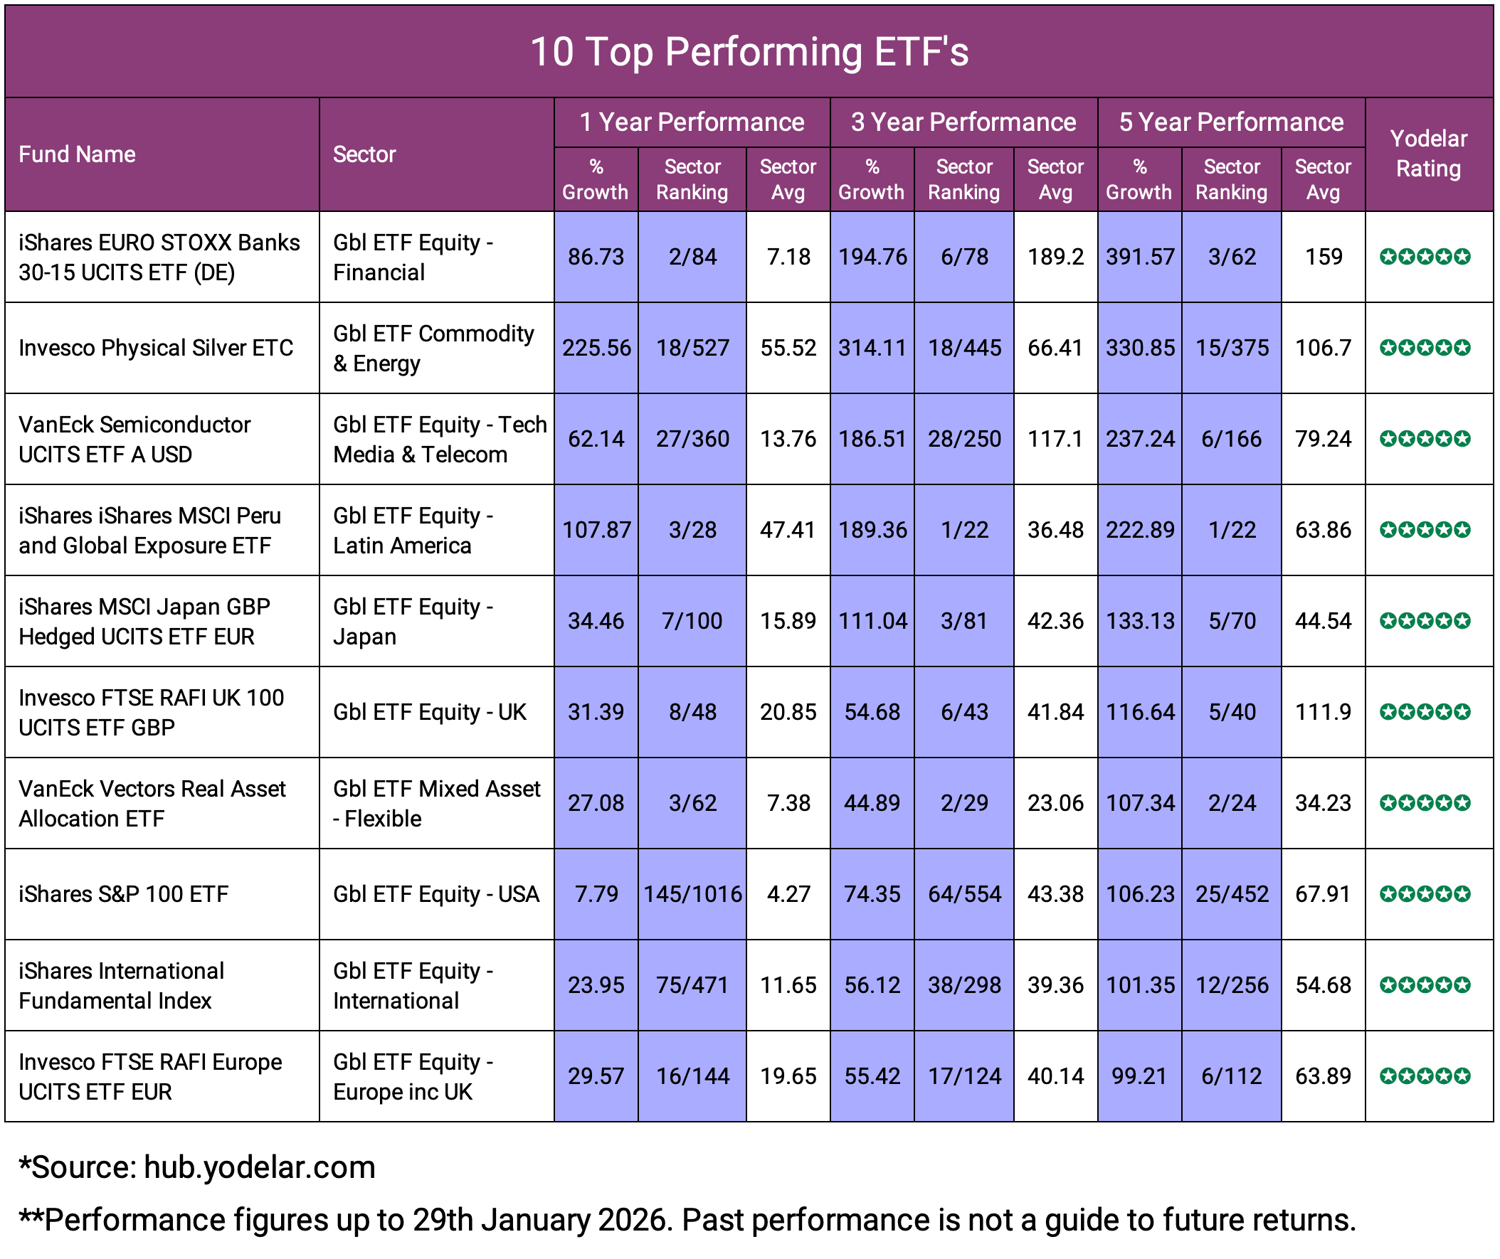
1. iShares EURO STOXX Banks 30-15 UCITS ETF (DE)
Sector: Global ETF Equity – Financials
This ETF tracks the EURO STOXX Banks 30-15 Index, which includes major Eurozone banking groups and caps individual holdings at 15% to limit concentration.
Over 1 year, it returned 86.73%, ranking 2nd out of 84 funds in its sector, compared with a 7.18% sector average.
Over 3 years, it delivered 194.76%, ranking 6th out of 78, versus 189.2%.
Over 5 years, it returned 391.57%, ranking 3rd out of 62, compared with 159%.
Its 5-year ranking places it among the highest-performing financial ETFs in its sector.
2. Invesco Physical Silver ETC
Sector: Global ETF Commodity & Energy
This ETC provides direct exposure to the spot price of silver. Each unit is backed by physical silver held in custody.
Over 1 year, it returned 225.56%, ranking 18th out of 527 funds, compared with 55.52% for the sector.
Over 3 years, it delivered 314.11%, ranking 18th out of 445, versus 66.41%.
Over 5 years, it returned 330.85%, ranking 15th out of 375, compared with 106.7%.
Performance reflects movements in the silver price rather than equity market returns.
3. VanEck Semiconductor UCITS ETF A USD
Sector: Global ETF Equity – Technology, Media & Telecom
This ETF tracks an index of US-listed semiconductor and chip-equipment companies, with a cap applied to individual stock weightings.
Over 1 year, it returned 62.14%, ranking 27th out of 360 funds, compared with 13.76%.
Over 3 years, it delivered 186.51%, ranking 28th out of 250, versus 117.1%.
Over 5 years, it returned 237.24%, ranking 6th out of 166, compared with 79.24%.
Its multi-period performance places it consistently above the sector median.

4. iShares MSCI Peru and Global Exposure ETF
Sector: Global ETF Equity – Latin America
This ETF tracks the MSCI All Peru Capped Index, focusing on companies with significant economic exposure to Peru.
Over 1 year, it returned 107.87%, ranking 3rd out of 28 funds, compared with 47.41%.
Over 3 years, it delivered 189.36%, ranking 1st out of 22, versus 36.48%.
Over 5 years, it returned 222.89%, ranking 1st, compared with 63.86%.
Its ranking across the 3 and 5-year periods reflects sustained strength relative to Latin America peers.
5. iShares MSCI Japan GBP Hedged UCITS ETF
Sector: Global ETF Equity – Japan
This ETF tracks a Japanese equity index while hedging currency exposure to sterling.
Over 1 year, it returned 34.46%, ranking 7th out of 100 funds, compared with 15.89%.
Over 3 years, it delivered 111.04%, ranking 3rd out of 81, versus 42.36%.
Over 5 years, it returned 133.13%, ranking 5th out of 70, compared with 44.54%.
Its sector ranking across each period demonstrates consistent relative performance.
6. Invesco FTSE RAFI UK 100 UCITS ETF
Sector: Global ETF Equity – UK
This ETF tracks the FTSE RAFI UK 100 Index. Companies are weighted using measures such as sales, dividends, cash flow and book value rather than market size.
Over 1 year, it returned 31.39%, ranking 8th out of 48 funds, compared with 20.85%.
Over 3 years, it delivered 54.68%, ranking 6th out of 43, versus 41.84%.
Over 5 years, it returned 116.64%, ranking 5th out of 40, compared with 111.9%.
Returns remained above the sector average across all periods analysed.
7. VanEck Real Asset Allocation ETF
Sector: Global ETF Mixed Asset – Flexible
This ETF allocates across assets such as commodities, infrastructure, real estate and gold through a rules-based approach.
Over 1 year, it returned 27.08%, ranking 3rd out of 62 funds, compared with 7.38%.
Over 3 years, it delivered 44.89%, ranking 2nd out of 29, versus 23.06%.
Over 5 years, it returned 107.34%, ranking 2nd out of 24, compared with 34.23%.
Its relative performance has remained near the top of its sector across the periods analysed.
8. iShares S&P 100 ETF
Sector: Global ETF Equity – USA
This ETF tracks the S&P 100 Index, comprising 100 of the largest US-listed companies.
Over 1 year, it returned 7.79%, ranking 145th out of 1,016 funds, compared with 4.27%.
Over 3 years, it delivered 74.35%, ranking 64th out of 554, versus 43.38%.
Over 5 years, it returned 106.23%, ranking 25th out of 452, compared with 67.91%.
Its long-term ranking places it within the higher-performing US large-cap ETFs.

9. iShares International Fundamental Index ETF
Sector: Global ETF Equity – International
This ETF tracks the FTSE RAFI Developed ex US 1000 Index. Companies are selected and weighted based on financial measures such as revenues, dividends, cash flow and book value rather than market capitalisation.
Over 1 year, it returned 23.95%, ranking 75th out of 471 funds, compared with 11.65%.
Over 3 years, it delivered 56.12%, ranking 38th out of 298, versus 39.36%.
Over 5 years, it returned 101.35%, ranking 12th out of 256, compared with 54.68%.
Performance relative to sector averages remained consistent across all three periods.
10. Invesco FTSE RAFI Europe UCITS ETF
Sector: Global ETF Equity – Europe including UK
This ETF tracks the FTSE RAFI Europe Index, weighting companies based on fundamental financial data rather than market size.
Over 1 year, it returned 29.57%, ranking 16th out of 144 funds, compared with 19.65%.
Over 3 years, it delivered 55.42%, ranking 17th out of 124, versus 40.14%.
Over 5 years, it returned 99.21%, ranking 6th out of 112, compared with 63.89%.
Its 5-year ranking places it among the stronger-performing ETFs in its sector.

Conclusion
The analysis of 7,071 ETFs highlights how wide performance differences can be within the same sector. While a small proportion delivered sustained above-average returns across the 1, 3 and 5-year periods analysed, the majority did not outperform their peers over multiple timeframes.
ETFs provide efficient access to markets, but performance dispersion remains significant.
Understanding how an ETF is constructed, what it tracks and how it compares with sector peers remains central to assessing long-term efficiency.
Reviewing Your Investment Portfolio
Holding multiple ETFs does not automatically create effective diversification. Different ETFs can track similar markets, hold many of the same companies or carry exposure to the same regions and sectors. As a result, portfolios that appear balanced on the surface may still be concentrated beneath it.
A Yodelar Portfolio Analysis reviews each holding against its sector average and assesses how the ETFs work together within the wider portfolio. It highlights duplication, concentration and areas where returns have fallen behind sector peers.
If you have not reviewed your portfolio recently, a structured analysis can provide a clearer view of how efficiently your investments are working and whether the overall balance remains aligned with your objectives.


