

-
61.7% of the 4,239 funds analysed received a 1 or 2 star Yodelar rating based on their historic sector-relative performance. Only 17.7% achieved a 4 or 5 star rating.
-
Fewer than 1 in 10 funds (9.7%) ranked in the top quartile of their sector over all of the 1, 3 and 5 year periods.
-
A similar proportion (10.8%) ranked in the bottom quartile of their sector across all three periods.
-
In the IA Global sector, the gap between the strongest and weakest fund over 5 years was almost 300 percentage points.
Two funds. The same sector. The same five years.
The Artemis SmartGARP UK Equity fund returned 127.51% over the 5 years to 30th September 2026, the strongest result among 188 funds in the IA UK All Companies sector with a full performance history. Over the same period, in the same sector, the abrdn UK Mid Cap Equity fund fell 31.91%.
Both are UK equity funds. Both would appear on a portfolio statement as a reasonable sounding holding. An investor who held one rather than the other would have had a profoundly different outcome, from the same market, over the same period.
That gap is not an isolated case. Our latest analysis of 4,239 funds across 55 Investment Association sectors shows that the difference between the funds investors could have held is consistently far larger than the difference between the markets they invest in.

How the 4,239 Funds Rated
Yodelar Ratings grade each fund on its historic performance relative to other funds in the same IA sector over multiple periods. The latest distribution, using data to 30th September 2026, is shown below.
| Yodelar Rating | Number of Funds | % of Funds Rated |
|---|---|---|
| ✪✪✪✪✪ | 281 | 6.6% |
| ✪✪✪✪ | 471 | 11.1% |
| ✪✪✪ | 873 | 20.6% |
| ✪✪ | 1,295 | 30.5% |
| ✪ | 1,319 | 31.1% |
*Source: hub.yodelar.com. Figures show average returns for funds in each sector over the stated periods, to 30th September 2026. Past performance is not a reliable indicator of future returns.
How Yodelar Rates Fund Performance
By construction, sector-relative ratings will always place some funds at the bottom. What the distribution shows is not that most funds lost money, but that a majority of funds have persistently ranked in the weaker half of their sector across the periods measured, while a comparatively small group has ranked consistently well.
For investors, the relevant question is simple. Which group are your funds in? Most portfolio statements do not say.
The Gap Within Sectors Is Bigger Than the Gap Between Them
Investors often focus on which markets to invest in. The data suggests that which fund they hold within a market can matter even more.
The table below shows the strongest fund, the sector average, and the weakest fund over 5 years in four of the most widely held IA sectors.
|
IA Sector |
Strongest Fund (5 Yr) |
Sector Average (5 Yr) |
Weakest Fund (5 Yr) |
|---|---|---|---|
|
Global |
241.15% |
49.32% |
-48.87% |
|
North America |
180.25% |
67.24% |
-15.49% |
|
UK All Companies |
127.51% |
38.93% |
-31.91% |
|
Mixed Investment 40-85% Shares |
106.09% |
35.07% |
0.42% |
*Source: hub.yodelar.com. Figures show average returns for funds in each sector over the stated periods, to 30th September 2026. Past performance is not a reliable indicator of future returns.
In the IA Global sector, which holds more UK investor money than any other, 428 funds have a full 5 year history. The strongest returned 241.15%. The weakest lost 48.87%. The sector average was 49.32%.
Every one of those 428 funds could reasonably be described as “a global fund”. The label tells an investor very little about the outcome they actually received.
Some of this dispersion reflects deliberate differences in approach. A global energy fund, a gold equity fund and a broad global tracker all sit in the same sector while doing very different jobs, which is why sector ranking should always be read alongside a fund’s purpose. But much of the gap sits between funds with broadly similar objectives, and that is the gap investors are rarely shown.

Consistency Is Rarer Than Investors May Think
A strong year tells an investor very little on its own. A more demanding test is whether a fund has ranked well against its peers across multiple periods.
Of the funds analysed:
- 9.7% ranked in the top quartile of their sector over all of the 1, 3 and 5 year periods.
- 27.3% ranked in the top half of their sector across all three periods.
- 29.0% ranked in the bottom half across all three periods.
- 10.8% ranked in the bottom quartile across all three periods.
In other words, roughly 1 fund in 10 has been persistently excellent relative to its peers, and roughly 1 fund in 10 has been persistently poor. The majority sit somewhere in between, drifting across the rankings from one period to the next.
Two points follow from this, and they pull in different directions.
The first is that persistent underperformance does exist, and it is not rare. More than 450 of the funds analysed ranked in the bottom quartile of their sector over 1, 3 and 5 years simultaneously. Investors holding such funds deserve, at minimum, a clear explanation of why they are being retained.
The second is that consistency is measured backwards, not forwards. A fund that has ranked well for five years is not assured of ranking well for the next five, and investment styles move in and out of favour. Historic consistency is evidence worth examining. It is not a promise.
Why Investors Rarely See This
Most investors judge their portfolio by one number: whether it went up.
In a period when most markets rise, almost every portfolio goes up, including those built largely from funds that have persistently ranked near the bottom of their sectors. Growth alone is not evidence of quality. It may simply be evidence that markets rose.
Three habits help investors see past the headline figure:
Compare each fund with its own sector, not with the portfolio total. A fund’s 1, 3 and 5 year sector rankings reveal what the combined portfolio figure conceals.
Look for persistence, in both directions. One weak year is noise. Bottom-half rankings across 1, 3 and 5 years is a pattern that deserves an explanation.
Ask why each fund is held. A lower ranked fund may play a deliberate role, such as risk reduction or diversification. The problem is not holding one. The problem is holding one without knowing it, or without a reason.
Find Out How Your Funds Rank
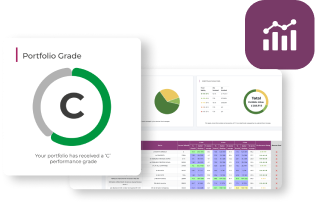
Yodelar’s free portfolio analysis shows you exactly where each of your funds sits within this data. Where sufficient performance history is available, the analysis provides each fund’s 1, 3 and 5 year performance, its ranking within the relevant IA sector, the sector average return, its historic Yodelar performance rating, the proportion of your portfolio held in each rating band, and an overall portfolio performance grade.
Yodelar Ratings are based on historic sector-relative performance. They do not assess personal suitability, are not a recommendation, and should not be treated as a guide to future returns.
To complete the analysis, upload a recent portfolio statement or provide a list of the funds you hold and the approximate amount invested in each. The service is free, and there is no obligation to make changes or proceed with financial advice.

What the Data Cannot Tell You
A factual analysis of this kind can show how your funds have performed and how they rank against comparable alternatives. It cannot determine whether your portfolio is personally suitable, whether you are taking an appropriate level of risk, whether changing an investment would create tax consequences, or whether your retirement and withdrawal plans are sustainable.
Those questions require personal advice. UK-based investors can book a no-obligation call with an FCA-authorised financial adviser from our advice partner, MKC Wealth, to discuss their portfolio alongside their objectives, investment period, attitude to risk and ability to withstand investment losses. Any personal recommendation would only be made after a full assessment of your circumstances, with the risks, costs and ongoing services clearly explained.

Summary
Across 4,239 funds, the latest data shows a wide and persistent quality gap. A small minority of funds have ranked consistently near the top of their sectors across 1, 3 and 5 year periods. A similarly sized group has ranked consistently near the bottom. The difference in outcomes between them, within the same sectors and the same markets, has been substantial.
No rating or ranking can predict which funds will lead the next five years, and a portfolio built purely by chasing past winners carries its own risks. But investors are entitled to know where their funds have ranked, how much of their portfolio sits in persistently weak performers, and why each holding is there.
For most investors, simply seeing that information for the first time is the most valuable review they will have had.

Important Risk Warning
This article is for information only and does not constitute personal financial advice or a recommendation to buy, sell or switch any investment.
Past performance is not a reliable indicator of future performance. Yodelar Ratings are based on historic performance compared with funds in the same Investment Association sector. They do not assess personal suitability and should not be treated as a guide to future returns.
The value of investments and any income from them can fall as well as rise. Investors could get back less than they invest. Anyone who is unsure whether an investment or portfolio is suitable for them should seek personal advice from an FCA-authorised financial adviser.