


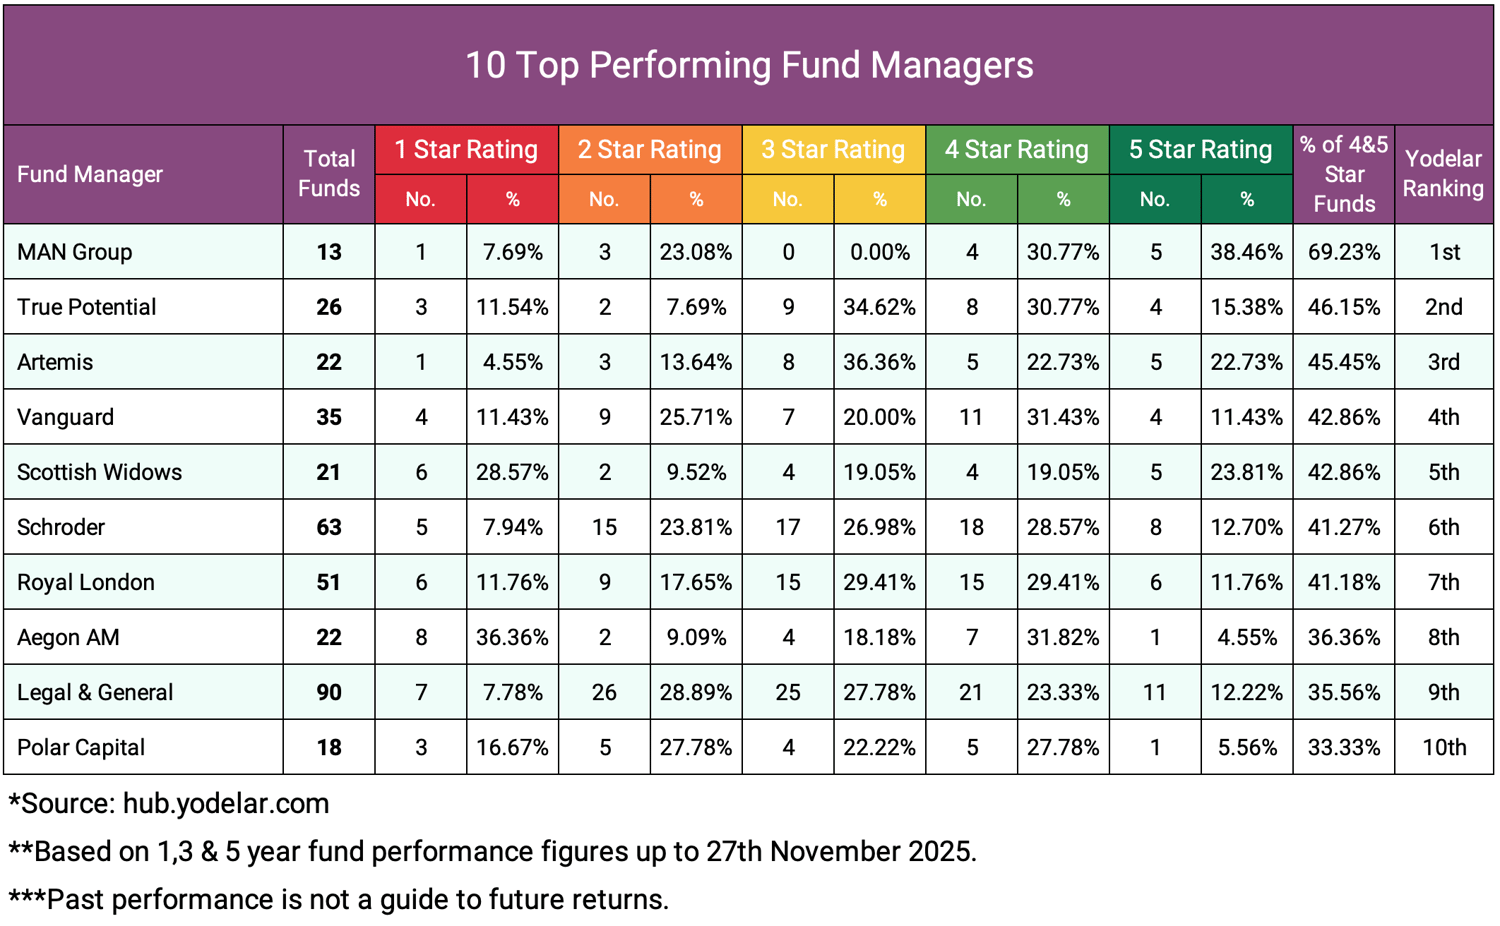
- MAN Group achieved the strongest overall results, with more than two thirds of its assessed funds outperforming their sector averages.
- True Potential, Artemis, Vanguard, and Scottish Widows also delivered competitive outcomes, each recording more than 40% of funds rated 4 or 5 stars.
- Larger managers such as Schroder and Legal and General showed strong pockets of performance, though results varied widely across their full ranges.
- Several fund groups demonstrated a mix of strong and weaker results, highlighting the importance of reviewing funds individually rather than relying on brand recognition.
- Only a small proportion of fund managers produced a high concentration of funds that outperformed consistently across the 1, 3, and 5 year periods analysed.
Fund performance in 2025 has shown clear differences between fund management brands that delivered strong results and those that were less consistent. With thousands of funds available to UK investors, understanding which fund management brands have achieved competitive results over multiple timeframes can provide valuable context when reviewing a portfolio.
Familiar brands remain popular, yet our analysis shows that well known names do not always offer the strongest performing options. Some managers had a high concentration of funds that outperformed their sector averages, while others delivered a mix of competitive and weaker results.
This report highlights the managers that achieved the highest proportion of funds with strong performance over 1, 3, and 5 years, offering a clearer view of which fund groups demonstrated consistent competitiveness within their sectors in 2025.

Identifying the Top Fund Managers
The Yodelar Fund Manager League Table was developed using Investment Association classified funds with at least one year of available performance data. A total of 2,906 funds from 80 fund management brands were analysed for this latest report.
Each fund was compared against its IA sector average over 1, 3, and 5 years using the Yodelar performance rating system. This system awards ratings from 1 to 5 stars based on relative sector performance.
Fund management brands were then ranked by the proportion of their funds achieving a 4 or 5 star rating. These ratings indicate funds that have delivered stronger results than their sector average over the assessed timeframes.
This method focuses on the breadth of a brand’s fund range rather than individual standout strategies, providing a clearer picture of how consistently each fund group has delivered historic performance within its sectors.
Overall Fund Performance Summary
Alongside assessing each fund manager, we also reviewed the performance and rating distribution of the 2,906 Investment Association classified funds included in this study. The table below shows how these funds were rated based on their performance relative to their sector averages over 1, 3, and 5 years.
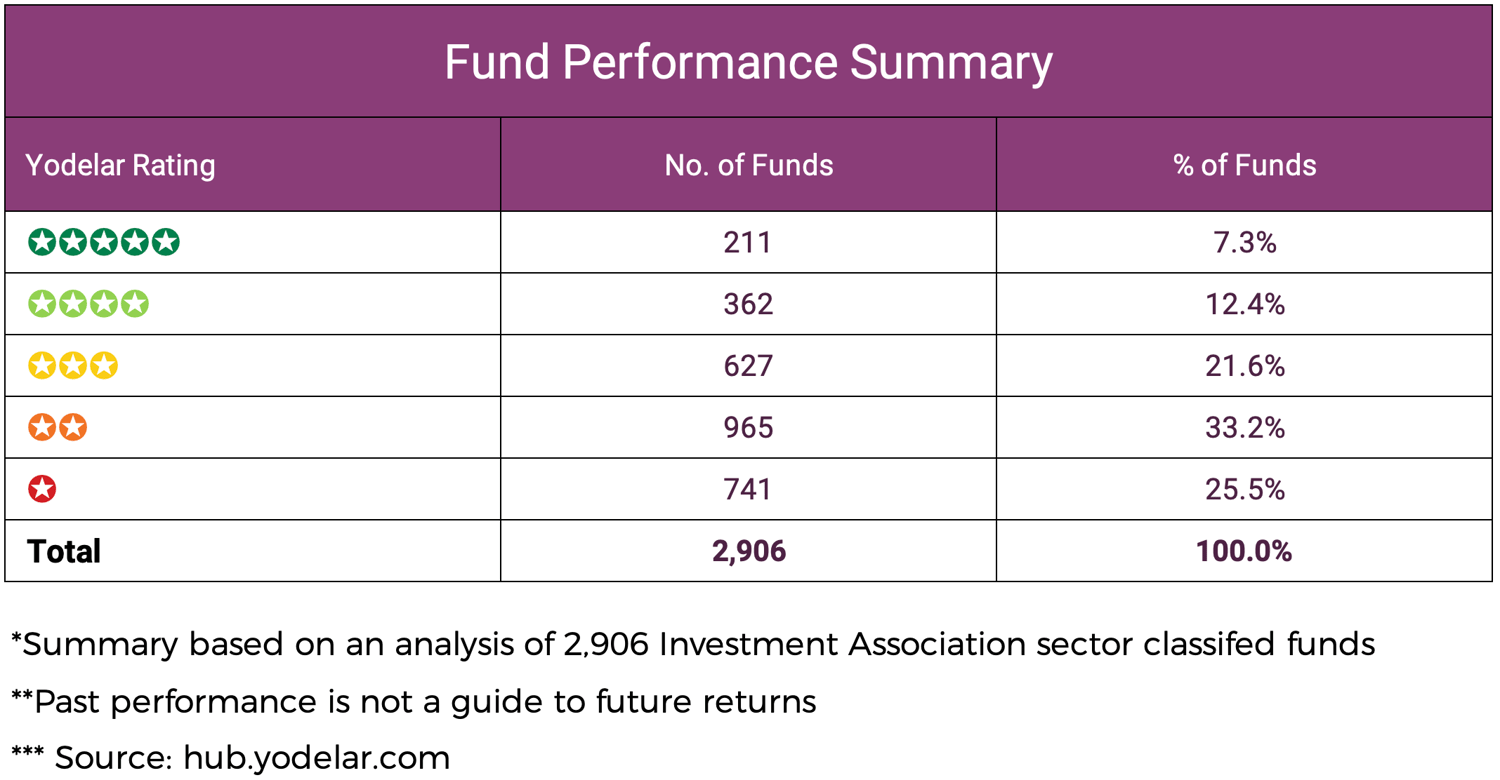
The above table highlights the proportion of funds that achieved stronger results as well as those that rated poorly, providing useful context for understanding the wider market landscape in 2025.
10 Top Performing Fund Managers
The following table shows the 10 top ranking fund management groups that delivered the strongest overall historic performance based on the share of their funds with a 4 or 5 star Yodelar rating.
MAN Group
MAN Group ranked first, with 69.23% of its assessed funds receiving a 4 or 5 star rating. Five funds achieved 5 stars and four achieved 4 stars. Only one fund was rated 1 star, indicating limited weakness across the range based on historic results.
True Potential
True Potential achieved a 46.15% share of funds rated 4 or 5 stars. Four funds received a 5 star rating, while more than one third were rated 3 stars. Three funds were rated 1 star. The rating distribution shows a mix of stronger and weaker historic sector relative results across the range.
Artemis
Artemis recorded 45.45% of funds at 4 or 5 stars. Five funds achieved 5 star status, and most remaining funds sat within the 3 star category. This suggests a generally stable level of sector relative results across its assessed strategies.
Vanguard
Vanguard delivered 42.86% 4 and 5 star funds across its large fund range. Eleven funds achieved a 4 star rating and four achieved 5 stars. While four funds were rated 1 star, the overall distribution shows a sizeable proportion of competitive historic sector relative performance, particularly across its index based mandates.
Scottish Widows
Scottish Widows also achieved 42.86% of funds at 4 or 5 stars. The group produced five 5 star funds and four 4 star funds. Six funds received a 1 star rating, reflecting more variation across the product suite, though several strategies delivered stronger historic results within their sectors.

Schroder
Schroder manages one of the largest fund ranges in this analysis. Of the 63 funds reviewed, 41.27% achieved a 4 or 5 star rating. Eighteen received 4 stars and eight received 5 stars. Lower rated funds were also present, highlighting diversity of outcomes across the broader range.
Royal London
Royal London recorded 41.18% of funds at 4 or 5 stars. Six funds received 5 stars and 15 received 4 stars. While six funds were rated 1 star, the data shows that a notable portion of the fund range delivered competitive historic results compared to sector averages.
Aegon Asset Management
Aegon Asset Management had 36.36% of funds rated 4 or 5 stars. Seven funds achieved 4 stars and one achieved 5 stars. Eight funds were rated 1 star, indicating variation in sector relative results across the range. Several strategies, however, demonstrated stronger historic performance.
Legal and General
Legal and General has the largest number of funds in this table. Of the 90 funds assessed, 35.56% achieved 4 or 5 stars. This included 11 funds with a 5 star rating and 21 with a 4 star rating. The presence of lower rated funds reflects the broad scope of strategies offered.
Polar Capital
Polar Capital ranked tenth, with 33.33% of funds receiving a 4 or 5 star rating. One fund achieved 5 stars and five achieved 4 stars. The group also had three 1 star funds, showing that results varied between strategies.

Access The Full League Table
The complete fund manager league table provides the performance assessment and ranking of all 80 fund management brands included in our analysis. It shows how each group performed based on the proportion of their funds that outperformed their sector averages over 1, 3, and 5 years, offering a clear view of where competitive results were most evident across the wider market.
Conclusion
Performance across the 1, 3, and 5 year periods analysed varied significantly between fund managers. Only a small number delivered a high concentration of funds that outperformed their sector averages, and even among the highest ranked groups, results were not consistent across every fund they offer.
These findings highlight the value of assessing funds individually rather than relying on brand recognition. With clear differences in historic outcomes, investors who periodically review the competitiveness of their holdings are better placed to understand whether their portfolios remain aligned with their objectives.

Ensure Your Portfolio Is Performing Efficiently
No fund management group consistently outperforms across every strategy it offers. The data shows that strong performing funds can be found across a wide range of fund houses, and weaker performing funds can appear in all of them.
A Yodelar Portfolio Analysis provides a clear, independent review of how your existing funds have performed relative to their sector averages. This includes identifying funds that have historically lagged behind similar risk alternatives, highlighting duplication, and assessing overall portfolio structure.
Investors can upload their portfolio securely to receive a detailed breakdown of historic performance and charges. This evidence based review helps investors understand whether their current holdings remain efficient and whether adjustments may be worth exploring with a qualified adviser.


