


- Across 4,199 IA sector-classified funds, the average five-year return for top-quartile funds was 63.14%, compared with 7.12% for bottom-quartile funds - a difference of 56.02% within the same sectors.
- In the IA Technology & Technology Innovation sector, top-quartile funds averaged 142.25% over five years, while bottom-quartile funds averaged 15.0%, highlighting a 127.25% spread within one sector.
- Within IA UK All Companies, the five-year average was 87.84% for top-quartile funds and 7.22% for bottom-quartile funds, creating an 80.62% difference.
- In IA Global, top-quartile funds averaged 91.33% over five years compared with 12.48% for bottom-quartile funds, a difference of 78.85% within the same sector.
- Only 9.91% of funds ranked in the top quartile across 1, 3 and 5 years, while 11.00% remained in the bottom quartile across all three periods, showing that sustained lower rankings have been slightly more common than sustained higher rankings.
Many investors judge their portfolio using two simple measures: growth and cost. Both matter, as do other factors that sit outside the scope of this article. But growth and cost alone do not explain why two investors holding funds in the same sector, over the same period, can experience very different results.
To understand this more clearly, we analysed 4,199 Investment Association (IA) sector classified funds across 55 sectors. Of these, 3,553 funds had complete 1, 3 and 5 year performance data and were included in the full consistency analysis.
The findings show that fund selection within a sector has had a clear impact on long term outcomes. Over five years, the difference between funds at the top of their sector and those at the bottom has been substantial. When compounded over time, that gap can meaningfully shape overall portfolio growth.
All analysis is based on historical data and compares funds against their sector averages over the periods reviewed.
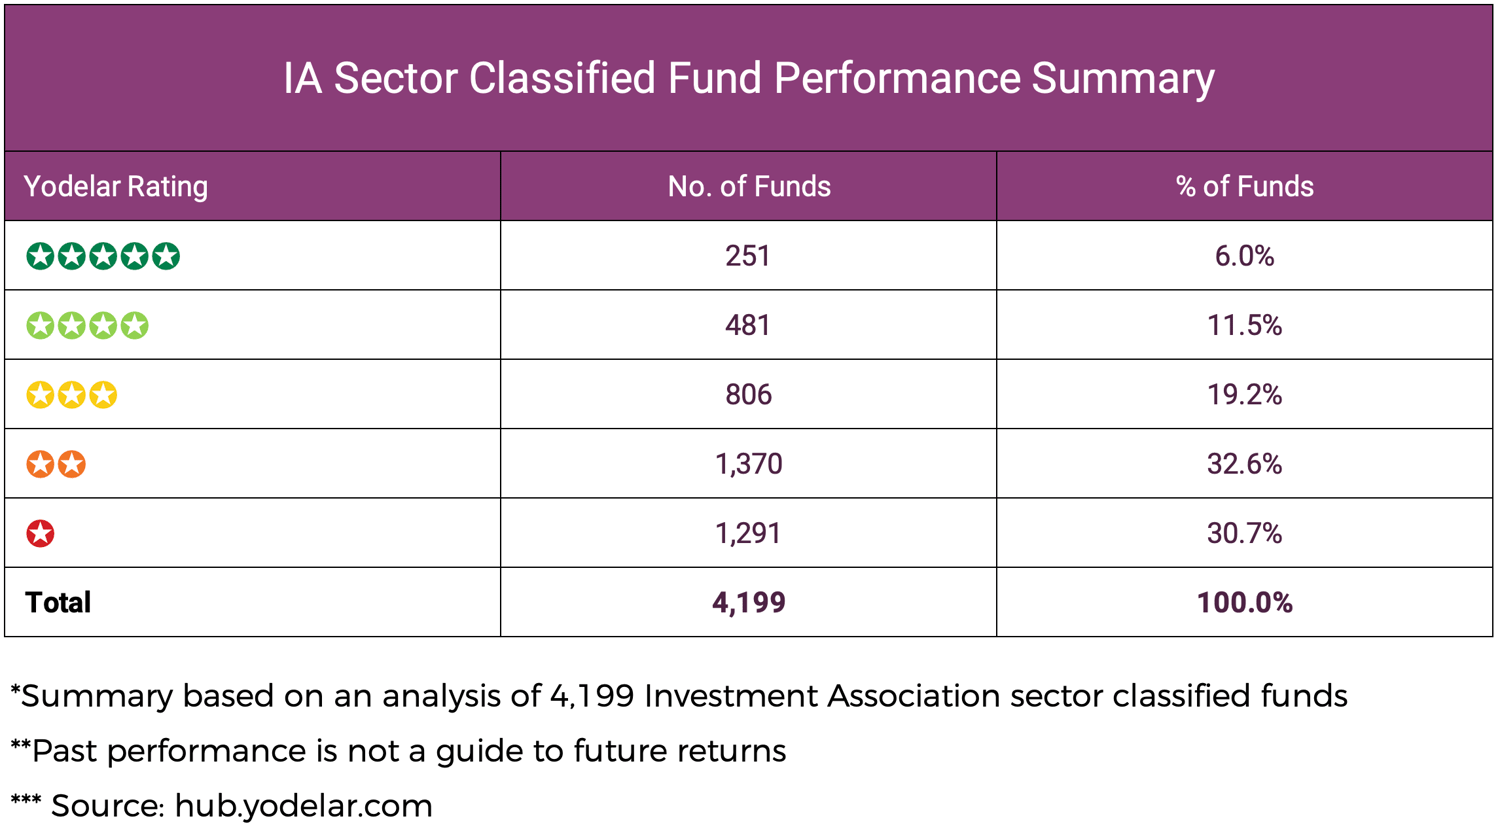
Performance Summary
More than 60% of funds fall into the 1 or 2-star categories based on their sector-relative historical positioning.
Higher ratings reflect stronger rankings relative to sector averages over the periods analysed. They are not forecasts. The distribution shows that a large proportion of funds have historically ranked below their sector averages.
The Data Behind the Analysis
The dataset includes 4,199 funds spanning 55 IA sectors and more than 100 fund management groups.
Each fund is assessed against others within the same IA sector to ensure like-for-like comparison. This avoids comparing funds with different mandates or risk profiles.
The Yodelar Rating framework ranks funds based on their positioning relative to sector averages over 1, 3 and 5 years. An additional overlay prevents the highest rating being awarded to funds that performed well overall but with significantly more volatility than their peers. This approach focuses on sector positioning and consistency rather than isolated results.
The Scale of the Performance Gap
Across all sectors reviewed, the average five-year return for top-quartile funds was 63.14%. For bottom-quartile funds, the average was 7.12%.
This represents a difference of 56.02% over five years within the same sector.
In practical terms, two investors allocating to the same IA sector over the same period could have experienced significantly different growth purely because of the specific fund selected.

Where the Gap Is Most Pronounced
While performance gaps exist across most sectors, the scale of difference in several large sectors stands out.
IA Technology & Technology Innovation
In this sector, the average five-year return for top-quartile funds was 142.25%, compared with 15.0% for bottom-quartile funds.
That is a difference of 127.25% over five years within the same sector.
Even in a sector that delivered strong overall returns, the spread between higher- and lower-ranking funds was wide.
IA UK All Companies
Among 206 IA UK All Companies funds with five-year data, the average five-year return for top-quartile funds was 87.84%, compared with 7.22% for bottom-quartile funds.
This represents a difference of 80.62% over five years within the same sector.
Despite being a broad and widely used UK equity sector, the variation in outcomes remains significant.
IA Global
Within the IA Global sector, which includes 414 funds with five-year data, the average five-year return for top-quartile funds was 91.33%, compared with 12.48% for bottom-quartile funds.
This represents a difference of 78.85% over five years within the same sector.
As with all funds, sector exposure alone did not determine the result. The specific fund selected within the IA Global sector played a clear role in long-term outcomes.
Charges: Relevant, But Not the Whole Story
Across all funds with five-year data, the average ongoing charge for top-quartile funds was 0.80%. For bottom-quartile funds, the average was 1.00%.
Higher-ranking funds, on average, did not carry higher charges. In fact, lower-ranking funds were associated with higher average charges across the dataset.
However, cost alone does not explain differences in sector rankings. In certain specialist sectors, higher-ranking funds carried higher charges, reflecting differences in structure or investment mandate.
Charges should therefore be assessed alongside sector positioning and consistency of results. Looking at cost in isolation does not provide a full picture.

Consistency Across Time
Of the 3,553 funds with complete 1, 3 and 5-year data, relatively few maintained extreme rankings across all periods.
-
352 funds, or 9.91%, ranked in the top quartile across all three periods.
-
391 funds, or 11.00%, ranked in the bottom quartile across all three periods.
Funds that remained in the bottom quartile were slightly more common than those that remained in the top quartile.
This shows that sustained lower rankings have not been unusual. At the same time, consistent top-quartile positioning has been limited to a minority of funds.
A strong single-year result has not typically indicated consistent performance across longer periods.
What This Means in Practice
The data highlights three practical conclusions.
First, choosing the right sector is only part of the decision. The specific fund selected within that sector has historically made a clear difference to long-term results.
Second, charges need to be viewed alongside sector positioning. Higher costs have not consistently led to stronger rankings, and lower costs alone have not ensured better outcomes.
Third, diversification is not simply about holding several funds. In sectors such as Global and Technology, many higher-ranking funds hold similar underlying companies. Owning multiple funds within the same sector can therefore increase concentration rather than reduce it.
Most portfolios will typically hold a range of funds across different sectors, providing a mix of asset types and geographic exposure in line with their mandate. However, effective diversification should be assessed at overall portfolio level, rather than simply by the number of funds held.

Understanding What Your Portfolio Is Really Exposed To
Many portfolios have become increasingly reliant on the same regions, companies and currencies.
Individual fund performance can appear reasonable in isolation. However, when funds are combined within a wider portfolio, underlying exposure can overlap significantly. In many portfolios reviewed through Yodelar’s analysis process, holdings that appear diversified often share substantial exposure to North American equities and technology-driven businesses.
This is usually a consequence of investors buying into well-performing areas to take advantage of the growth. When those areas perform strongly, that concentration may go unnoticed. When they weaken, the impact can be felt across multiple holdings at the same time.
A portfolio analysis helps bring this into focus. Rather than examining funds individually, Yodelar’s portfolio analysis assesses how holdings work together. It highlights where exposure overlaps, where performance has ranked below sector averages, and how much of the overall outcome is linked to specific regions or currencies.
Understanding how funds interact within a portfolio is often where the most meaningful improvements can be identified.


