


-
We analysed 2,398 Investment Association (IA) sector-classified funds with a full 10-year track record, assessing performance across the 1, 5 and 10-year periods analysed.
-
Only 18% of funds achieved a 4 or 5-star Yodelar rating over 10 years.
-
62% of funds received a 1 or 2-star rating, meaning the majority failed to outperform their sector averages across multiple periods.
-
The top-performing funds identified ranked above their sector averages over all three periods analysed, demonstrating sustained competitiveness rather than short-term strength.
-
Strong long-term results were not confined to one region or asset class, with leading funds emerging across European equities, global equities, emerging markets, UK equities and global bonds.
A ten-year period provides a meaningful timeframe for assessing fund performance. Short-term returns can reflect temporary market trends, but sustained growth across 5 and 10 years offers clearer evidence of consistency within a sector.
To identify the strongest long-term performers, we analysed 2,398 Investment Association sector-classified funds with a complete 10-year track record. Each fund was assessed over the 1, 5 and 10-year periods analysed, with returns compared against their respective sector averages and rankings within each IA sector.
The objective was to determine which funds with at least a ten-year track record have outperformed their sector peers and which have consistently underperformed over the long term.

10-Year Performance Distribution
Of the 2,398 IA sector-classified funds with a full 10-year record:
- 434 funds, or 18%, achieved a 4 or 5-star Yodelar rating based on consistent outperformance across the periods analysed.
- 1,485 funds, or 62%, received a 1 or 2-star rating, indicating returns below their sector average across multiple periods.

The distribution highlights the wide variation in long-term outcomes within the same sectors. While a small proportion of funds delivered consistent above-average returns, the majority did not outperform their sector averages across all timeframes.
This underscores a consistent theme in our findings: sector exposure on its own does not dictate results. Rigorous fund selection remains essential.
10 of the Top Performing Funds Over 10 Years
The funds below ranked above their sector averages across the 1, 5 and 10-year periods analysed and achieved a 5-star Yodelar rating.
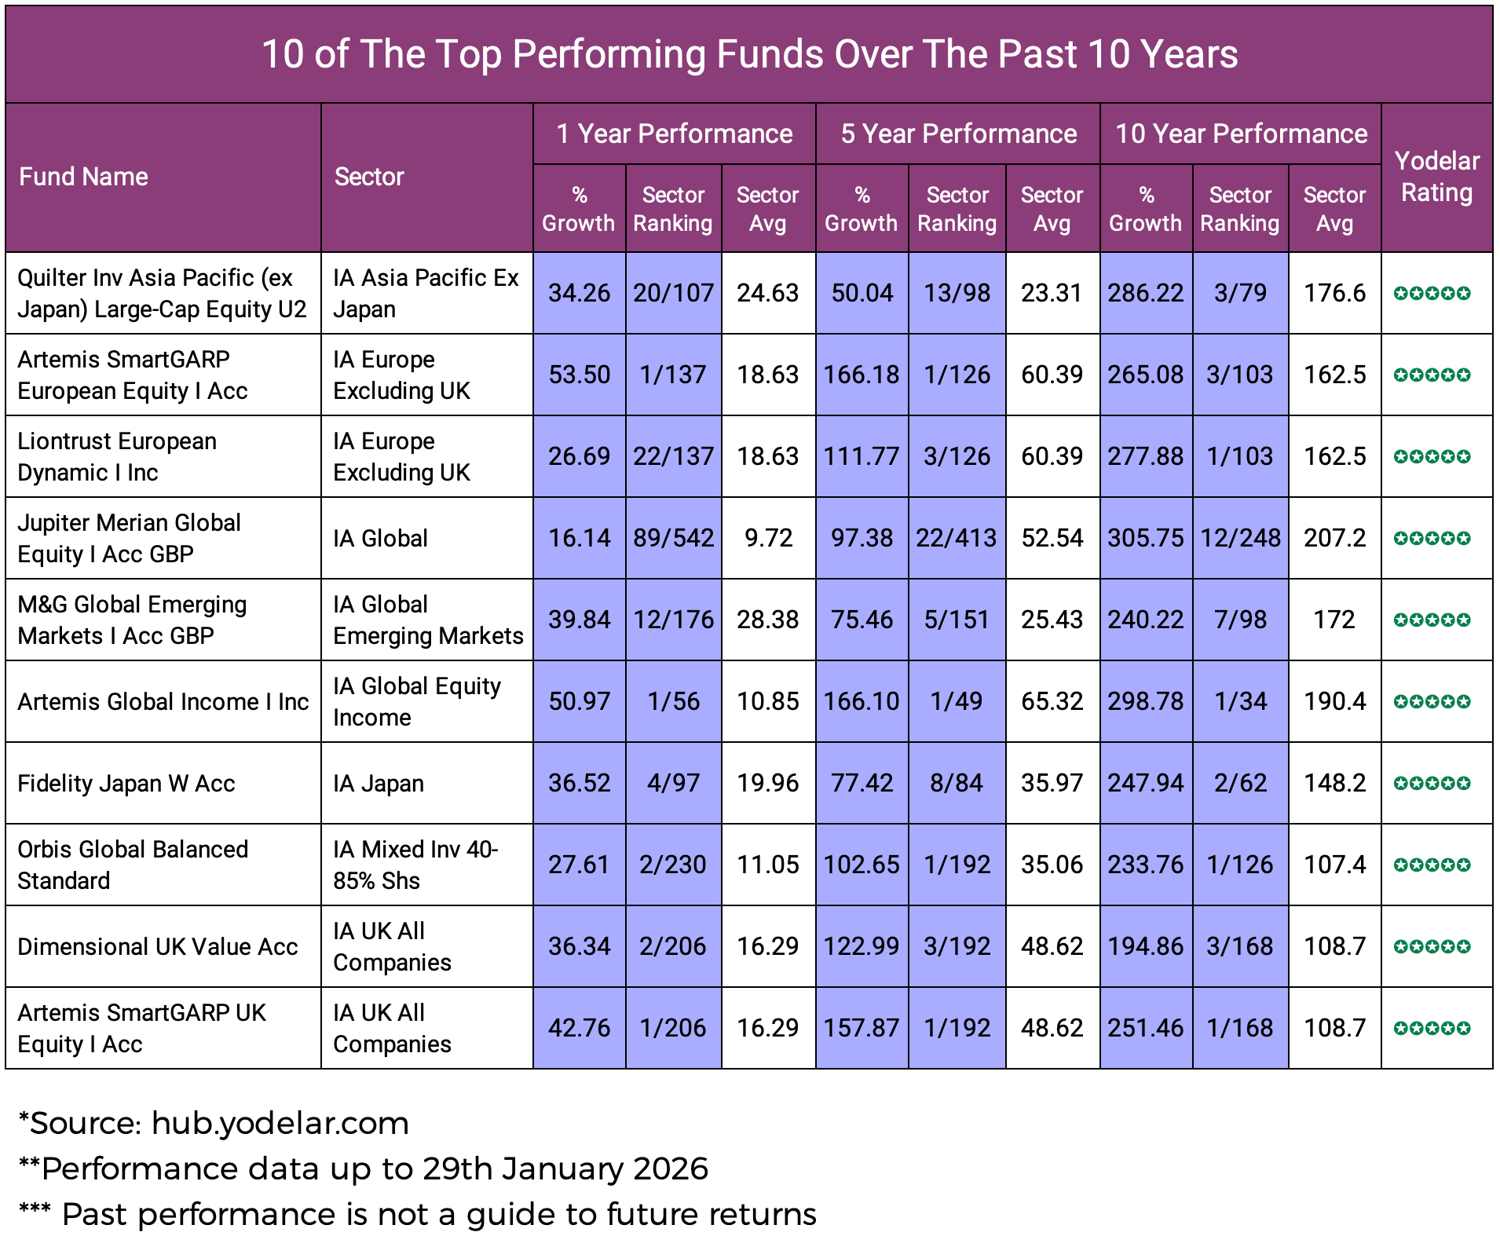
1. Quilter Investors Asia Pacific (ex Japan) Large Cap Equity U2
IA Sector: Asia Pacific Excluding Japan
This fund invests primarily in large-cap companies across the Asia Pacific region excluding Japan.
- Over 10 years, it delivered 286.22% growth, ranking 3rd out of 79 funds in its sector.
- Over 5 years, it returned 50.04% compared with the sector average of 23.31%.
- Over 1 year, it delivered 34.26% versus the sector average of 24.63%.
It ranked above its sector average across all three periods analysed.
2. Artemis SmartGARP European Equity I Acc
IA Sector: Europe Excluding UK
This fund invests in European companies outside the UK. It uses a structured quantitative screening approach, meaning it applies a rules-based system that reviews financial data such as company earnings, share price valuation and financial strength. Companies that meet the set criteria are then considered for inclusion in the portfolio.
- Over 10 years, it delivered growth of more than 265%.
- Over 5 years, it returned 166.18% compared with the sector average of 60.39%.
- Over 1 year, it delivered 53.50% versus the sector average of 18.63%.
It ranked 1st in its sector over both the 1 and 5-year periods analysed.
3. Liontrust European Dynamic I Inc
IA Sector: Europe Excluding UK
This fund invests in European companies outside the UK.
- Over 10 years, it delivered 277.88% growth compared with the sector average of 162.47%, ranking 1st out of 103 funds.
- Over 5 years, it returned 111.77% versus the sector average of 60.39%.
- Over 1 year, it delivered 26.69% compared with 18.63%.
It ranked consistently high within its sector over 10 years.
4. Jupiter Merian Global Equity I Acc GBP
IA Sector: Global
This fund invests in developed market global equities.
- Over 10 years, it delivered 305.75% growth compared with the sector average of 207.20%.
- Over 5 years, it returned 97.38% versus 52.54%.
- Over 1 year, it delivered 16.14% compared with the sector average of 9.72%.
It ranked consistently above its sector average across the periods analysed.

5. M&G Global Emerging Markets I Acc GBP
IA Sector: Global Emerging Markets
This fund invests primarily in companies based in, or deriving revenues from, emerging markets.
-
Over 10 years, it delivered 240.22% growth compared with the sector average of 171.95%.
-
Over 5 years, it returned 75.46% versus 25.43%.
-
Over 1 year, it delivered 39.84% compared with 28.38%.
It ranked above its sector average across all three periods.
6. Artemis Global Income I Inc
IA Sector: Global Equity Income
This fund invests globally in dividend-paying companies.
-
Over 10 years, it delivered 298.78% growth compared with the sector average of 190.43%, ranking 1st out of 34 funds.
-
Over 5 years, it returned 166.10% versus 65.32%.
- Over 1 year, it delivered 50.97% compared with 10.85%.
7. Fidelity Japan W Acc
IA Sector: Japan
This fund invests primarily in Japanese companies.
- Over 10 years, it delivered 247.94% growth compared with the sector average of 148.17%, ranking 2nd out of 62 funds.
- Over 5 years, it returned 77.42% versus 35.97%.
- Over 1 year, it delivered 36.52% compared with 19.96%.
It ranked consistently above its sector average across the periods analysed.

8. Orbis Global Balanced Standard
IA Sector: Mixed Investment 40–85% Shares
This fund invests primarily in global equities alongside other assets within a balanced mandate.
- Over 10 years, it delivered 233.76% growth compared with the sector average of 107.44%, ranking 1st out of 126 funds.
- Over 5 years, it returned 102.65% versus 35.06%.
- Over 1 year, it delivered 27.61% compared with 11.05%.
It ranked 1st over both the 5 and 10-year periods analysed.
9. Dimensional UK Value Acc
IA Sector: UK All Companies
This fund invests in UK companies. It uses a systematic value-based approach, meaning it follows a rules-based process to identify companies that appear lower priced compared with measures such as earnings or company assets. Companies that meet these set value criteria are then included in the portfolio.
- Over 10 years, it delivered 194.86% growth compared with the sector average of 108.69%, ranking 3rd out of 168 funds.
- Over 5 years, it returned 122.99% versus 48.62%.
- Over 1 year, it delivered 36.34% compared with 16.29%.
It ranked consistently within the top group of funds in its sector.
10. Artemis SmartGARP UK Equity I Acc
IA Sector: UK All Companies
This fund invests in UK companies using a structured investment framework.
- Over 10 years, it delivered 251.46% growth, ranking 1st out of 168 funds.
- Over 5 years, it returned 157.87%, again ranking 1st out of 192.
- Over 1 year, it delivered 42.76% compared with the sector average of 16.29%.

Conclusion
The past decade highlights the wide variation in outcomes across IA sectors. While a small proportion of funds delivered consistent above-average returns across the 1, 5 and 10-year periods analysed, the majority did not outperform their sector averages across all timeframes.
Strong long-term performance is therefore not evenly distributed, even within the same sector.
This reinforces the importance of assessing funds individually rather than relying on reputation or brand recognition alone.
Ensuring Your Portfolio Is Structured Efficiently
Even among top-performing funds, many share overlapping regional or sector exposures. Holding multiple funds within the same IA sector does not automatically provide diversification if underlying holdings are similar.
A Yodelar Portfolio Analysis provides an independent, evidence-based review of how each fund compares with its sector average. It identifies areas of underperformance, duplication, cost inefficiencies and structural concentration.
Rather than focusing solely on historic growth, the analysis assesses how holdings interact within the wider portfolio, helping ensure diversification is effective and aligned with long-term objectives.


