

-
The IA North America sector averaged 9.01% over 6 months, 23.11% over 1 year and 69.76% over 5 years.
-
The IA North American Smaller Companies sector averaged 20.25% over 6 months, showing stronger short-term momentum than the broader North America sector.
-
Despite strong average returns, 62.1% of IA North America funds and 57.6% of IA North American Smaller Companies funds were rated 1 or 2 stars.
-
The strongest IA North America fund returned 163.29% over 5 years, while the weakest returned -26.61%.
-
Investors should review their North America exposure carefully, especially where several funds may rely on similar US market drivers.
North American funds are a major part of many UK investor portfolios. They give access to some of the world’s largest companies and have delivered strong long-term returns across many parts of the sector.
But the latest data shows why investors should not assume all North America funds have performed well.
Our analysis reviewed funds in the Investment Association (IA) North America and IA North American Smaller Companies sectors using performance data to 30 June 2026. The results show strong sector averages, particularly over 5 years for the broader IA North America sector and over the first half of 2026 for North American smaller companies.
However, the gap between funds was wide. Some funds ranked among the strongest in their sectors, while others sat close to the bottom despite investing in the same broad region.
For investors, the key question is not whether North America has been a strong investment region. It is whether the specific North America funds they hold have performed competitively against sector peers and whether their exposure still fits the wider portfolio.

North America Fund Performance Summary
Across the IA North America funds reviewed, 17.2% received a top performing 4 or 5 star Yodelar Rating. In contrast, 62.1% received a poor 1 or 2 star rating by ranking among the bottom of their sector for performance over the periods analysed.
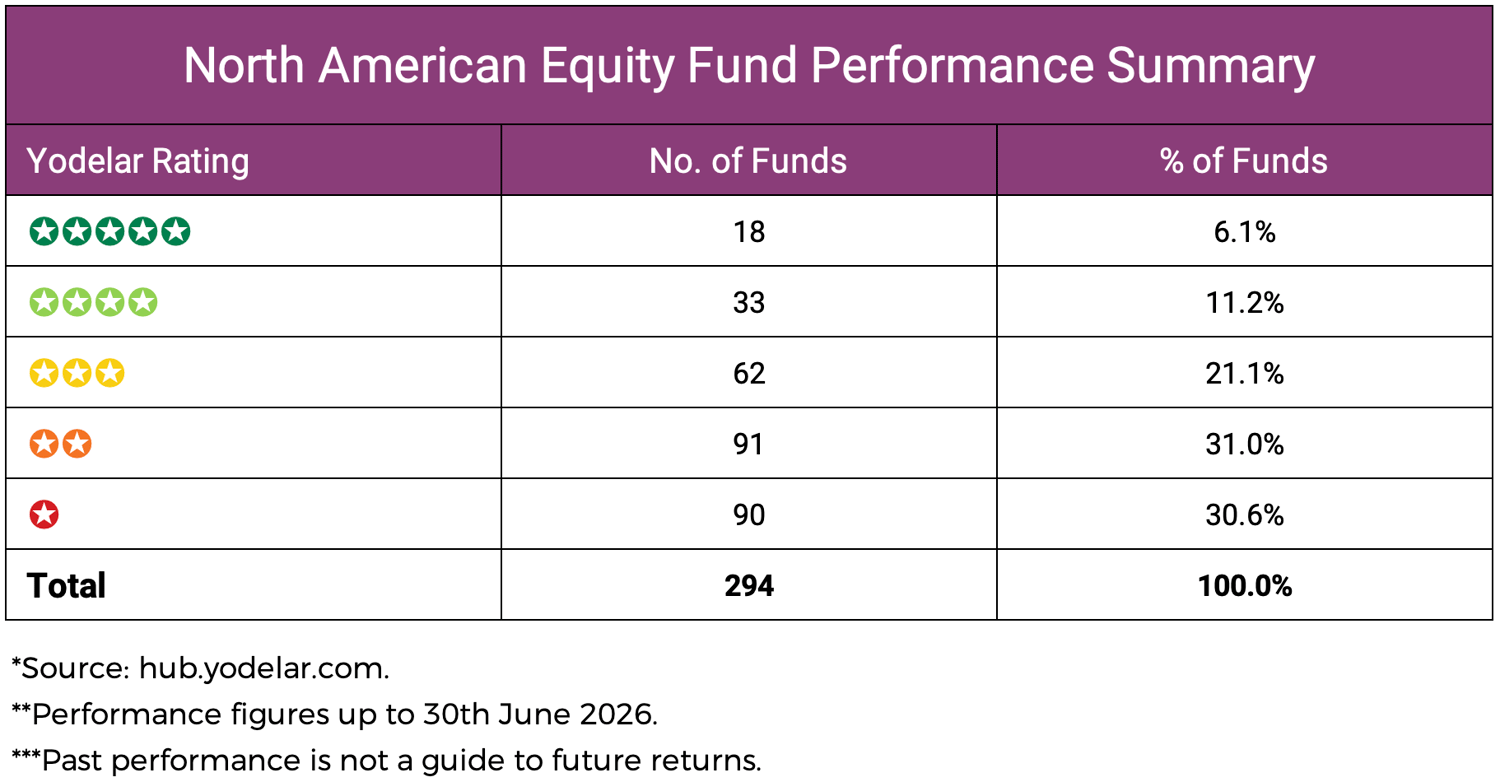
For IA North American Smaller Companies, 18.2% of funds received a 4 or 5 star Yodelar Rating, while 57.6% were rated 1 or 2 stars.
How Yodelar Rates Fund Performance
Yodelar Ratings are based on historic fund performance compared with funds in the same Investment Association sector. They are not a recommendation, do not assess personal suitability and should not be treated as a guide to future returns.
A 4 or 5 star rating indicates stronger historic performance against sector peers. A 1 or 2 star rating indicates weaker historic performance compared with competing funds in the same IA sector.
How Yodelar Rates Fund Performance
North America And Smaller Companies Compared
The broader IA North America sector delivered stronger average 5-year returns, while IA North American Smaller Companies produced stronger returns over the first half of 2026.
|
IA sector |
No. of Funds |
Avg 6-mth return |
Avg 1-year return |
Avg 3-year return |
Avg 5-year return |
4 or 5 star Yodelar Rating |
1 or 2 star Yodelar Rating |
|---|---|---|---|---|---|---|---|
|
IA North America |
261 |
9.01% |
23.11% |
58.26% |
69.76% |
17.2% |
62.1% |
|
IA North American Smaller Companies |
33 |
20.25% |
39.43% |
54.93% |
42.54% |
18.2% |
57.6% |
The data shows that smaller companies performed strongly in the first half of 2026, with average 6-month returns more than double the broader IA North America sector.
However, the broader IA North America sector had a much stronger 5-year average return. This matters because short-term performance should not be viewed in isolation.
North American smaller companies can behave differently from large US equities. They may offer different growth opportunities, but they can also carry different risks. Investors should understand whether that exposure is deliberate and whether it fits their wider portfolio.
5 Top Performing IA North America Funds
The table below shows five IA North America funds with the highest 5-year returns in the dataset. These funds are not recommendations. They are included to show where the strongest historic returns were achieved within the sector.
|
Fund |
6-month return |
1-year return |
5-year return |
5-year sector rank |
Yodelar Rating |
|---|---|---|---|---|---|
|
Xtrackers MSCI USA Information Technology UCITS ETF 1D USD |
16.98% |
39.75% |
163.29% |
1/212 |
5 stars |
|
Alger Focus Equity z us |
12.98% |
41.96% |
143.41% |
2/212 |
4 stars |
|
State Street SPDR S&P U.S. Energy Select Sector UCITS ETF |
24.76% |
33.56% |
140.12% |
3/212 |
3 stars |
|
iShares Edge MSCI USA Value Factor UCITS ETF USD |
49.67% |
88.83% |
124.61% |
4/212 |
5 stars |
|
Alger American Asset Growth z us |
11.58% |
37.37% |
121.03% |
5/212 |
4 stars |
These five funds all sit within the IA North America sector, but they are not trying to achieve returns in the same way. Some are focused on technology, energy or value shares, while others are actively managed growth funds. That matters because two funds can sit in the same sector but carry very different risks and return patterns.
Xtrackers MSCI USA Information Technology UCITS ETF
This was the strongest 5-year performer in the IA North America sector, returning 163.29% and ranking 1st out of 212 funds. The fund tracks the MSCI USA Information Technology Index, which means it is focused on US technology companies rather than the wider US market.
For investors, the key point is concentration. This fund delivered the strongest historic return in the sector, but it is not a broad North America fund. It gives targeted exposure to one part of the US market, so its performance can be heavily influenced by the strength or weakness of US technology shares.
Alger Focus Equity
Alger Focus Equity returned 143.41% over 5 years and ranked 2nd out of 212 funds. The fund seeks long-term capital appreciation and typically holds a smaller number of companies, with Fidelity data showing around 50 holdings. It is also described as non-diversified, which means each stock selection can have a larger impact on returns.
This makes the fund very different from a broad US tracker. It relies more heavily on the manager’s ability to select the right companies. That can help performance when those choices work well, but it can also increase risk if the portfolio’s chosen companies fall out of favour.
State Street SPDR S&P U.S. Energy Select Sector UCITS ETF
This fund returned 140.12% over 5 years and ranked 3rd out of 212 funds. It tracks large US energy companies within the S&P 500, meaning its returns are linked to the energy sector rather than the wider North American equity market.
For investors, this is an important distinction. The fund has produced strong historic returns, but it is a sector-specific fund. It may behave very differently from a broad US equity fund because it is heavily influenced by oil, gas and energy company performance.
iShares Edge MSCI USA Value Factor UCITS ETF
This fund returned 124.61% over 5 years, ranked 4th out of 212 funds and achieved a 5 star Yodelar Rating. It tracks an index made up of US shares that seek to capture companies considered undervalued relative to their financial measures.
In simple terms, this fund is not simply buying the biggest US companies. It is tilted towards companies that appear cheaper based on measures such as earnings, sales or assets. That can make it behave differently from growth-focused US funds, especially when investors favour lower-valued shares.
Alger American Asset Growth
Alger American Asset Growth returned 121.03% over 5 years and ranked 5th out of 212 funds. The fund’s objective is long-term capital appreciation and it invests mainly in companies with promising growth potential whose shares are listed or traded on a US exchange.
This is a growth-focused approach. The fund aims to benefit from companies expected to grow strongly over time, rather than simply tracking the US market. For investors, the strong historic return should be considered alongside the fact that growth funds can be more sensitive when market leadership changes.

5 Top Performing IA North American Smaller Companies Funds
The IA North American Smaller Companies sector produced a strong average 6-month return of 20.25%, compared with 9.01% for the broader IA North America sector.
The table below shows five of the strongest 5-year performers in the sector. These funds are not recommendations. They are included to show how different smaller company strategies performed over the period reviewed.
|
Fund |
6-month return |
1-year return |
5-year return |
5-year sector rank |
Yodelar Rating |
|---|---|---|---|---|---|
|
CT US Smaller Companies C Inc |
21.41% |
50.88% |
81.96% |
1/28 |
4 stars |
|
Heptagon Driehaus US Micro Cap Equity SGB Unhedged Acc GBP |
27.45% |
80.43% |
76.46% |
2/28 |
4 stars |
|
FTF Royce US Smaller Companies W Acc GBP |
26.23% |
46.88% |
57.75% |
8/28 |
4 stars |
|
GS US Small Cap CORE Equity Portfolio R Snap GBP |
24.16% |
52.73% |
71.11% |
4/28 |
5 stars |
|
FTGF Royce US Small Cap Opportunity X Acc USD |
32.21% |
57.16% |
66.73% |
5/28 |
4 stars |
Smaller company funds are not just smaller versions of broad US equity funds. They can behave differently because they invest in companies that may be more sensitive to the economy, borrowing costs and investor sentiment. For some portfolios they may add useful exposure, but they can also increase risk if the allocation is too large or not properly understood.
CT US Smaller Companies
CT US Smaller Companies was the strongest 5-year performer in the IA North American Smaller Companies sector, returning 81.96% and ranking 1st out of 28 funds. The fund aims for long-term capital growth and invests mainly in smaller and medium-sized US companies, with the manager defining these as companies with a market value below 10 billion US dollars at the time of purchase.
This gives investors exposure to a different part of the US market from large company funds. Its strong sector ranking shows it performed well against competing funds in the same sector, but investors should still consider whether smaller company exposure fits their risk level and time horizon.
Heptagon Driehaus US Micro Cap Equity
Heptagon Driehaus US Micro Cap Equity returned 76.46% over 5 years and ranked 2nd out of 28 funds. The strategy primarily invests in US micro-cap companies with good growth potential, using research into factors such as competitive position, industry trends and growth catalysts.
This makes the fund more specialist than a standard smaller companies fund. Micro-cap companies are generally smaller and can be more volatile, so the strong historic return should be viewed alongside the higher level of risk that can come with this type of exposure.
FTF Royce US Smaller Companies W Acc GBP
FTF Royce US Smaller Companies returned 57.75% over 5 years and ranked 8th out of 28 funds in the IA North American Smaller Companies sector. The fund invests in smaller US companies, but it is not simply trying to track the wider small-cap market. It uses an active approach, looking for businesses the manager believes have attractive long-term potential and share prices that do not fully reflect that opportunity.
For investors, this makes the fund different from a standard US smaller companies tracker. Its returns depend on the manager’s ability to identify smaller businesses with room to grow, rather than simply following the sector. The fund has delivered a positive long-term return, but it was not among the very top-ranked funds over 5 years.
GS US Small Cap CORE Equity Portfolio
GS US Small Cap CORE Equity returned 71.11% over 5 years, ranked 4th out of 28 funds and achieved a 5 star Yodelar Rating. The portfolio seeks longer-term capital growth and mostly holds shares in smaller US companies. It uses Goldman Sachs’ CORE approach, which is a model designed to assess different factors that may help forecast future returns.
For investors, the important point is that this is not a simple market tracker. It uses a structured process to select US smaller companies. Its 5 star Yodelar Rating reflects strong historic performance against sector peers, but this still does not make it automatically suitable for every portfolio.
FTGF Royce US Small Cap Opportunity
FTGF Royce US Small Cap Opportunity returned 66.73% over 5 years and ranked 5th out of 28 funds. The fund seeks long-term capital growth by investing at least 70% of its assets in small and micro-cap US companies. Its manager looks for what it believes are undervalued opportunities.
This gives the fund a different profile from growth-led smaller company funds. It looks for companies the manager believes are being overlooked or undervalued. That approach can be rewarding when the market recognises the value, but it may also require patience and can behave differently from the wider smaller companies sector.

Why The Performance Gap Matters
The data shows that North America has delivered strong returns across several areas, but fund selection still made a major difference.
In the IA North America sector, the strongest 5-year performer returned 163.29%, while the weakest returned -26.61%. That gap shows how two funds in the same sector can produce very different outcomes.
This does not mean investors should automatically choose the highest-returning funds. Many of the strongest performers were more focused than a broad North America fund, with exposure to areas such as technology, energy, value shares or smaller companies.
The more useful point is that investors should know what type of North America exposure they hold. A fund may be broad, sector-specific, growth-focused, value-focused, active, passive, large company or smaller company. These differences can have a major effect on performance and risk.
A fund should not remain in a portfolio just because it invests in a region that has generally performed well. It should be reviewed against competing funds in the same IA sector and assessed within the wider portfolio.

What Investors Should Review
Investors with North America exposure should review how that exposure is held and whether it is balanced within the wider portfolio.
|
Review question |
Why it matters |
|---|---|
|
Is the fund broad or specialist? |
A technology, energy or value fund may behave very differently from a broad US equity fund. |
|
Has the fund ranked well against sector peers? |
A fund can benefit from a strong region but still underperform competing funds in the same IA sector. |
|
Is there overlap with global funds? |
Many global funds already have meaningful US exposure. |
|
Is smaller company exposure deliberate? |
Smaller companies can provide diversification, but they can also carry different risks. |
|
Does the exposure match the investor’s objectives? |
US equity exposure should fit the portfolio’s time horizon and risk level. |
This type of review helps investors avoid relying only on the strength of the US market. The focus should be on whether the funds held are competitive, suitable and clearly contributing to the portfolio.
Start With A Free Portfolio Analysis
Many investors hold North America funds directly, while others hold US exposure through global funds, tracker funds or mixed investment portfolios.
Our free portfolio analysis reviews each fund individually, showing 1, 3 and 5-year performance, sector ranking and Yodelar Rating, where data is available. Yodelar Ratings are based on historic sector-relative performance and are not a guide to future returns.
The analysis can also help identify weaker-rated holdings, duplication, concentration, higher charges and funds that may no longer have a clear role.
Where appropriate, the analysis can compare backdated portfolio performance with a similar-risk MKC Invest model. This is a historic comparison only. It does not provide personal advice, is not a recommendation to invest in an MKC portfolio and should not be treated as a guide to future performance.
For investors with North America exposure, the analysis can help show whether the funds held have genuinely supported the portfolio or simply benefited from wider market strength.

Speak To An Adviser
For investors who want to understand whether their current portfolio remains suitable, a no obligation call with an adviser from our advice partner, MKC Wealth, can help.
The discussion can cover current holdings, portfolio analysis results, objectives, time horizon and attitude to risk. It can also explain how a more structured investment approach may compare with the portfolio currently held.
Any personal recommendation would only be made after understanding the investor’s financial position, investment objectives, time horizon and attitude to risk. Any recommendation would include a clear explanation of risks, costs and ongoing service.

Summary
North America has been an important source of returns for many investors, but the latest fund data shows that outcomes varied significantly by fund.
The IA North America sector averaged 69.76% over 5 years, while IA North American Smaller Companies produced stronger short-term performance in the first half of 2026. However, more than half of funds in both sectors were rated 1 or 2 stars.
That is the key issue for investors. Holding North America exposure is not enough. The fund selected, the level of concentration, the overlap with other holdings and the role within the portfolio all need to be reviewed.
The featured funds show how different North America exposure can be. Some were focused on technology or energy, some used a growth approach, some targeted value shares and others invested in smaller or micro-cap companies. They all sit within North America-related sectors, but they are not interchangeable.
Before assuming a US fund is doing its job, investors should check how it has performed against competing funds in the same IA sector.

Source and Methodology
Source: Yodelar analysis of IA North America and IA North American Smaller Companies funds using performance data to 30 June 2026.
Yodelar Ratings are based on historic fund performance relative to funds in the same Investment Association sector. Figures are rounded. Past performance is not a reliable guide to future returns.