

-
Yodelar analysed 4,236 Investment Association (IA) sector classified funds across 56 IA sectors, using performance data to 30 June 2026.
-
55 of the 56 IA sectors recorded a positive average return over the first six months of 2026.
-
The strongest average 6-month returns came from IA Asia Pacific Excluding Japan, IA Global Emerging Markets and IA Technology & Technology Innovation.
-
Several of the strongest sectors were linked to Asia, emerging markets, technology and smaller companies, showing where much of the market leadership came from.
-
Investors should not chase sector winners without first reviewing their current portfolio, fund rankings, sector exposure, risk level and whether each holding still has a clear role.
The first half of 2026 was positive for most Investment Association sectors, but the strongest returns were not spread evenly.
The leading sectors were concentrated in a small number of areas, including Asia Pacific equities, global emerging markets, technology, North American smaller companies and Japan. These sectors delivered much stronger average returns than the wider IA sector universe.
Many investors will hold a proportion of their portfolio in some or all of these sectors. But even for those that don’t, this poses an important question. Did their portfolio benefit from these areas, or has performance been held back by lower-performing funds in these sectors, or sectors that have lagged behind?
The answer is not always obvious from a platform statement. A portfolio may have performed well but still be relying too heavily on one region or theme. Equally, a portfolio may have missed some of the strongest sectors but still be appropriate if it is built around a different risk level, time horizon or objective.
Yodelar analysed 4,236 Investment Association sector-classified funds across 56 IA sectors, using performance data to 30 June 2026. The data shows which sectors led the market in the first half of the year, where momentum was strongest, and why investors should review how their own funds have performed.

What The Sector Data Shows
Across the 56 IA sectors reviewed, the average sector return over the first six months of 2026 was 6.30%, with a median sector return of 3.73%. This shows that the first half of the year was broadly positive, but it also shows that the highest returns were well above the wider sector average.
The leading sectors delivered returns of more than 20% over six months. By contrast, many bond, money market and lower-risk sectors produced much more modest returns, while IA India/Indian Subcontinent was the only sector with a negative average 6-month return.
This does not mean investors should simply move towards the sectors that performed best. Strong short-term sector performance can be driven by concentrated exposure to a specific region, investment style or market theme. Those areas can continue to perform well, but they can also reverse quickly.
The more useful point is that sector performance helps investors understand what has been driving results. If a portfolio has performed strongly, it may be because it had exposure to the right areas at the right time. If it has lagged, it may be because it was underweight the sectors that led the market or because individual funds underperformed within their own sectors.
The Top Performing IA Sectors
The table below shows the 10 strongest IA sectors by average 6-month return to 30 June 2026.
|
Rank |
IA sector |
Average 1 mth return |
Average 3 mth return |
Average 6 mth return |
|---|---|---|---|---|
|
1 |
IA Asia Pacific Excluding Japan |
0.92% |
20.08% |
26.72% |
|
2 |
IA Global Emerging Markets |
1.43% |
19.77% |
26.69% |
|
3 |
IA Technology & Technology Innovation |
-0.16% |
31.09% |
24.78% |
|
4 |
IA North American Smaller Companies |
6.84% |
21.13% |
20.78% |
|
5 |
IA Asia Pacific Including Japan |
1.27% |
15.20% |
20.04% |
|
6 |
IA Japan |
1.97% |
12.72% |
17.65% |
|
7 |
IA Infrastructure |
1.34% |
5.46% |
13.42% |
|
8 |
IA Specialist |
0.52% |
10.23% |
12.32% |
|
9 |
IA Latin America |
-1.55% |
-1.52% |
11.73% |
|
10 |
IA Listed Property |
2.55% |
10.58% |
10.76% |
The strongest areas were clearly tilted towards Asia and emerging markets. IA Asia Pacific Excluding Japan and IA Global Emerging Markets were almost level at the top, with average 6-month returns of 26.72% and 26.69%.
Technology also performed strongly, with the IA Technology & Technology Innovation sector returning 24.78% over six months. However, the sector’s latest 1-month average was slightly negative, which shows why investors should not judge momentum from one time period alone.
North American smaller companies also stood out, with an average 6-month return of 20.78% and the strongest 1-month return among the top five sectors. This suggests that smaller company exposure became a more important contributor as the first half of the year progressed.
Asia And Emerging Markets Led The First Half
The clearest theme in the data was the strength of Asia and emerging markets.
IA Asia Pacific Excluding Japan, IA Global Emerging Markets, IA Asia Pacific Including Japan and IA Japan all featured in the top six sectors. This shows that the strongest sector returns were not spread evenly across all global equity markets, but were heavily influenced by Asian and emerging market exposure.
For investors, this matters because fund and portfolio performance in the first half of 2026 may have been heavily affected by whether they held exposure to these areas. A portfolio with strong Asia or emerging market exposure may have benefited significantly. A portfolio with little or no exposure may have delivered more modest returns.
That does not automatically mean the portfolio was poorly positioned. Some investors may have lower-risk objectives, income needs or a time horizon that does not justify a large allocation to higher-growth areas. However, investors should understand whether their portfolio’s performance was shaped by deliberate positioning or simply by the funds they happened to hold.
A portfolio should not be assessed only by whether it held the strongest sectors. It should be assessed by whether each sector exposure is suitable, balanced and aligned with the investor’s objectives and capacity for investment risk.

Technology Remained A Major Contributor
The IA Technology & Technology Innovation sector delivered one of the strongest 6-month returns, with an average gain of 24.78%. It also had the highest average 3-month return of any sector in the dataset, at 31.09%.
That level of performance shows how important technology-linked exposure remained during the first half of 2026. However, the sector’s average 1-month return was -0.16%, which highlights the speed at which performance trends can change.
This is important for investors who may be tempted to increase exposure after seeing strong short-term returns. Technology funds can deliver powerful growth, but they can also increase concentration and volatility within a portfolio, particularly where investors already hold global equity funds with meaningful exposure to large technology companies.
The question is not whether technology funds have performed well. The data shows that the sector was one of the strongest areas of the first half. The more useful question is whether the investor already has enough exposure, whether that exposure is deliberate, and whether it fits their wider portfolio.
Some Sector Trends Shifted During The Period
Looking at 1-month, 3-month and 6-month returns together gives a clearer picture than looking at the 6-month number alone.
Some sectors that performed strongly over the full six-month period showed weaker recent momentum. IA Technology & Technology Innovation was up 24.78% over six months but slightly negative over the latest month. IA Latin America was up 11.73% over six months but negative over both one and three months. IA Commodity / Natural Resources also had a positive 6-month return of 10.59%, despite negative returns over both one and three months.
Other sectors showed stronger recent momentum. IA Healthcare and Biotechnology was only up 4.42% over six months, but it had the strongest average 1-month return in the dataset at 8.24%. IA India/Indian Subcontinent was the only sector with a negative 6-month average, at -6.47%, but it returned 5.35% over the latest month.
These changes show why short-term performance tables need care. A sector can be one of the strongest over six months but lose momentum recently. Another can remain weak over the full period but start to recover in the latest month.
Investors should avoid making decisions based only on the most recent winning sector. A better approach is to review how each fund has performed over several periods and whether the portfolio remains properly balanced.
The Wider Market Was Positive But Uneven
The first half of 2026 was broadly positive across the IA sector universe. 55 of the 56 IA sectors recorded positive average 6-month returns.
However, the spread of returns was wide. The strongest sector returned 26.72%, while the weakest returned -6.47%. This gap shows why sector allocation can make a meaningful difference to portfolio outcomes.
Lower-risk and bond-focused sectors generally produced more modest returns. Money market sectors, gilt sectors and several corporate bond sectors delivered positive but lower average returns compared with equity sectors. This is not a negative: these sectors play different roles within a portfolio and should not be judged in the same way as higher-growth equity sectors.
The key point is that sector performance should be viewed in context. A cautious fund sector is not expected to behave like a technology or emerging markets sector. The more important question is whether the investor’s portfolio is taking the right level of risk and whether the funds held are performing competitively within their own sectors.
What This Means For Investors
The strongest sectors of 2026 so far show where returns have been generated, but they do not automatically show where investors should invest next.
This distinction is important. Sector performance can help investors understand market leadership, but it should not be used as a simple buying list. A sector that has performed well may continue to do so, but it may also become more volatile or more expensive after a strong run.
For self-investors, the risk is chasing returns after they have already happened. This can lead to a portfolio that becomes too concentrated in the latest winners, rather than one built around the investor’s objectives, time horizon and attitude to risk.
A portfolio review should ask:
|
Review question |
Why it matters |
|---|---|
|
Which sectors am I already exposed to? |
Investors may already hold exposure through global or multi-asset funds. |
|
Did my funds perform well within their sectors? |
A fund can make money but still lag comparable funds. |
|
Am I too concentrated in one area? |
Strong recent sectors can increase portfolio risk if exposure becomes too high. |
|
Does each fund still have a clear role? |
Every holding should support the wider portfolio objective. |
|
Is the risk still suitable? |
Strong returns can hide the level of risk being taken. |
This approach helps investors avoid reacting only to recent sector performance. It also helps identify whether their own portfolio is being supported by strong fund selection or held back by weaker funds within otherwise strong sectors.
Download The Full IA Sector Fund Rankings
The sector tables show which IA sectors performed best in the first half of 2026, but they do not show how every fund within each sector performed.
That distinction matters. A sector may have performed strongly, but not every fund in that sector will have delivered competitive returns. Equally, a fund in a weaker sector may still have ranked well against its peers.
To support this analysis, readers can download the full IA sector fund rankings. The download provides performance data, sector ranking and Yodelar Rating for funds across each of the 56 Investment Association sectors reviewed.
This can help investors compare their own holdings with similar funds, rather than relying only on the performance of the wider sector.
The download is designed as a research tool. It does not provide personal advice and does not recommend whether to buy, sell or switch any investment.

Start With A Free Portfolio Analysis
The best-performing sectors of 2026 so far may explain part of market performance, but they do not show whether an individual investor’s portfolio is well positioned.
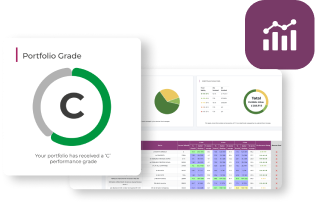
Our free portfolio analysis reviews each fund individually, showing 1, 3 and 5-year performance, sector ranking and Yodelar Rating, where data is available. It can also help identify weaker-rated holdings, duplication, concentration, higher charges and funds that may no longer have a clear role.
Where appropriate, the analysis can also compare backdated portfolio performance with an MKC Invest model portfolio with a similar risk and investment style. This is a historic comparison only. It does not provide personal advice, is not a recommendation to invest in an MKC portfolio and should not be treated as a guide to future performance.
For investors reviewing the strongest sectors of 2026 so far, the first step should not be chasing the top of the table. It should be checking whether their current portfolio is already positioned effectively and whether any changes would genuinely improve the overall structure.

Speak To An Adviser
For investors who want to understand whether their current portfolio remains suitable, a no obligation call with an adviser from our advice partner, MKC Wealth, can help.
The discussion can cover the investor’s current holdings, portfolio analysis results, long-term objectives, time horizon and attitude to risk. It can also explain how a more structured investment approach may compare with the portfolio currently held.
Any personal recommendation would only be made after understanding the investor’s financial position, investment objectives, time horizon and attitude to risk. Any recommendation would include a clear explanation of risks, costs and ongoing service.

Summary
The first half of 2026 was positive for most IA sectors, but the strongest returns were concentrated in a smaller number of areas.
IA Asia Pacific Excluding Japan, IA Global Emerging Markets and IA Technology & Technology Innovation were the three strongest sectors by average 6-month return. North American smaller companies, Asia Pacific Including Japan and Japan also performed strongly.
The data shows that sector exposure made a significant difference to outcomes. Investors with exposure to leading sectors may have benefited, while those without exposure may have seen more modest results. However, this does not mean investors should chase the sectors that have already performed best.
The more useful step is to review the portfolio already held. Investors should understand which sectors they are exposed to, whether their funds have performed competitively within those sectors, and whether the portfolio remains suitable for their objectives and risk profile.
Before making changes based on the best-performing sectors of 2026 so far, investors should first review their own portfolio and compare each fund with its sector peers.

Source and Methodology
Source: Yodelar analysis of 4,236 Investment Association sector-classified funds across 56 IA sectors, using performance data to 30 June 2026. All performance is shown in GBP.
Sector averages are based on available 1-month, 3-month and 6-month performance data. Figures are rounded.
Yodelar Ratings are based on historic fund performance relative to funds in the same Investment Association sector. Past performance is not a reliable guide to future returns.