


-
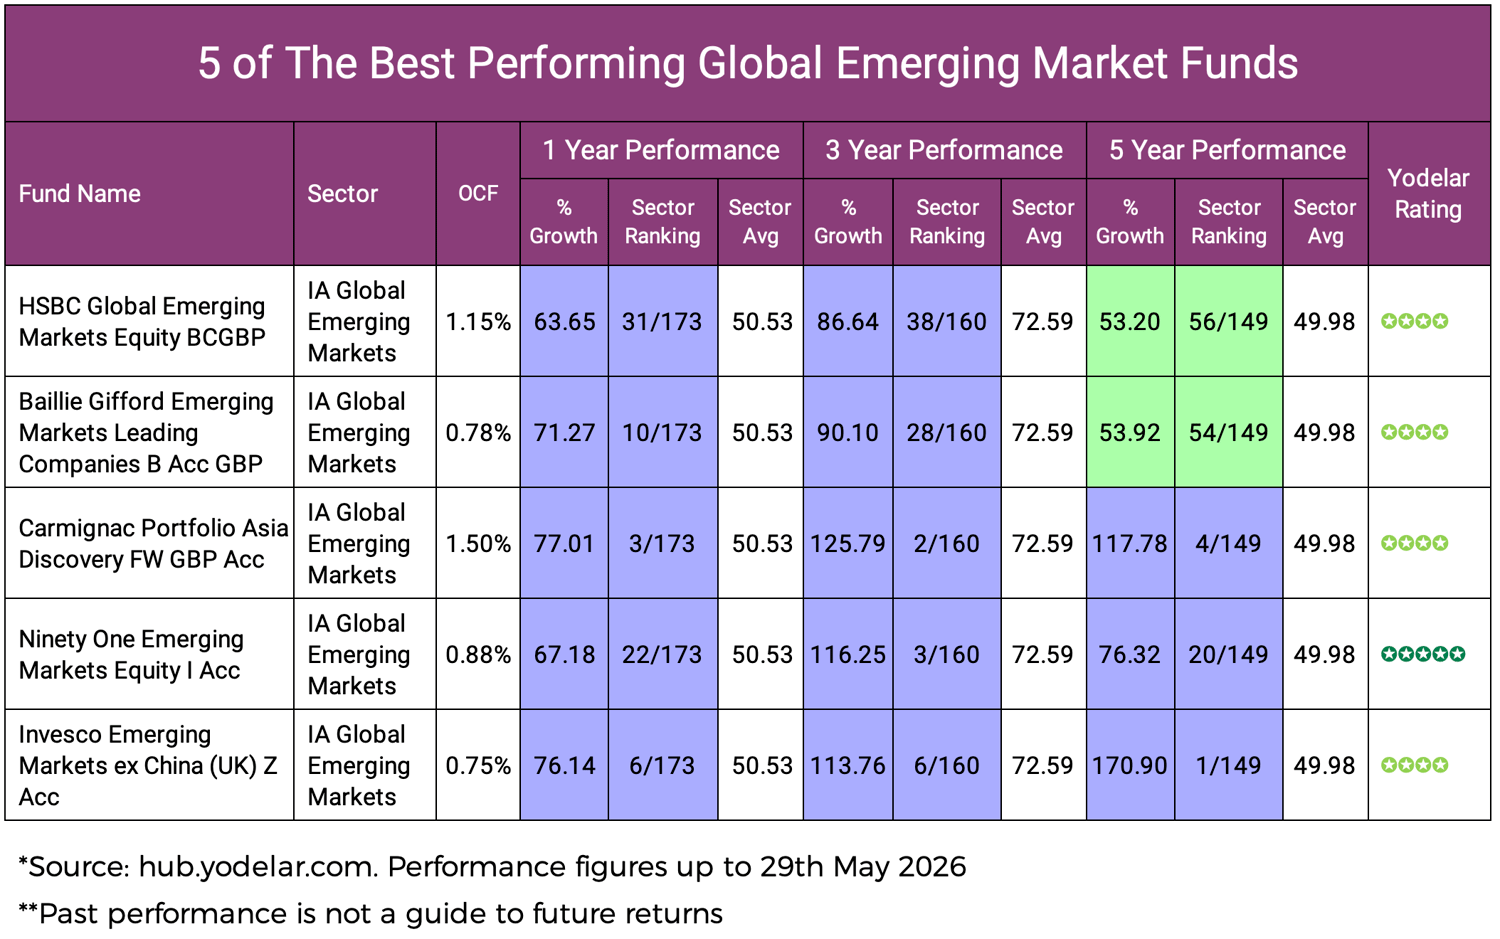
The IA Global Emerging Markets sector average was 50.53% over 1 year, 72.59% over 3 years and 49.98% over 5 years, based on performance figures up to 29 May 2026.
-
The strongest highlighted fund was Invesco Emerging Markets ex China (UK) Z Acc, which returned 170.90% over 5 years, ranking 1st out of 149 funds.
-
Carmignac Portfolio Asia Discovery FW GBP Acc delivered one of the strongest all-round records, ranking 3rd over 1 year, 2nd over 3 years and 4th over 5 years.
-
Some well-known funds lagged significantly, including Vanguard FTSE Emerging Markets UCITS ETF, which ranked 158th out of 173 funds over 1 year and 110th out of 149 over 5 years.
The gap between the stronger and weaker funds shows why emerging market fund selection, diversification and portfolio fit matter as much as the sector itself.
Emerging market funds can be exciting. They give investors access to economies and companies that may offer stronger long-term growth potential than more developed markets.
But they can also be difficult to get right.
These funds invest across countries that can behave very differently from each other. China, India, Taiwan, South Korea, Brazil, South Africa and other emerging markets all have their own risks, currencies, political backdrop and growth drivers. That means two funds in the same IA Global Emerging Markets sector can produce very different results.
The latest performance figures show just how wide that gap can be. The IA Global Emerging Markets sector average was 50.53% over 1 year, 72.59% over 3 years and 49.98% over 5 years. But among the highlighted funds, the strongest 5-year return was 170.90%, while several weaker funds delivered less than half the sector average over the same period.
That difference matters for investors. It shows that simply choosing an emerging markets fund is not enough. The specific fund, how it invests, which regions it favours, how much risk it takes and how it fits within the wider portfolio all need to be considered.

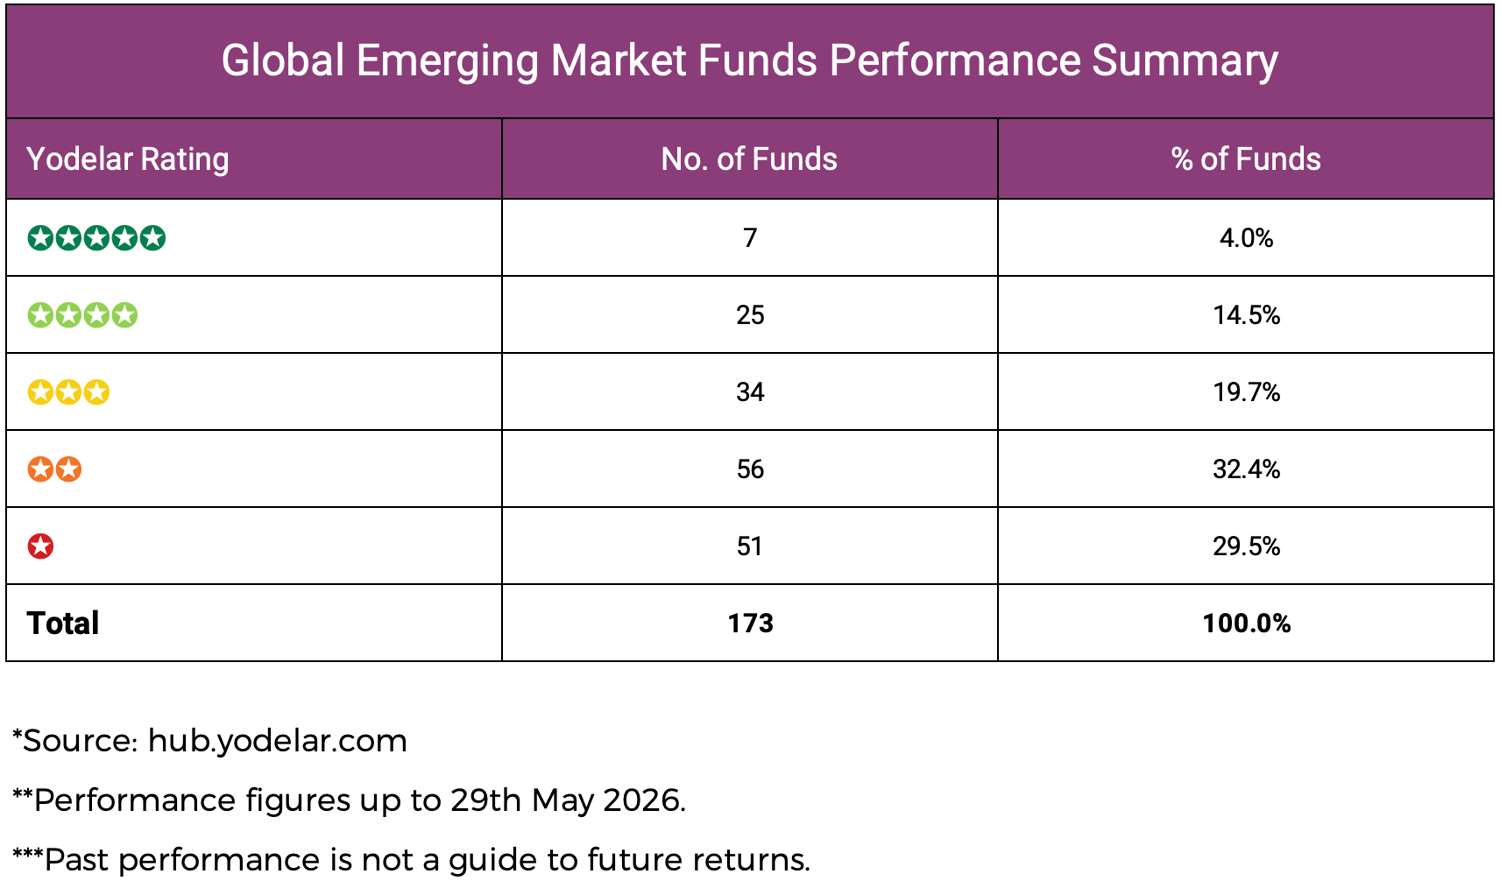
Global Emerging Market Funds Performance Summary
The Global Emerging Markets sector showed a wide spread of results. Of the 173 funds analysed, only 7 achieved a 5-star Yodelar rating and 25 received 4 stars. In contrast, 107 funds were rated 1 or 2 stars, representing 61.9% of the sector.
Understanding The IA Global Emerging Markets Sector
The IA Global Emerging Markets sector includes funds that invest across emerging economies. These are markets that are generally less developed than the UK, US, Europe or Japan, but which may offer higher growth potential over time.
In practice, this sector is not as simple as the label suggests.
Some funds have heavy exposure to Asia. Some have large positions in China or India. Others deliberately reduce or exclude China exposure. Some invest mainly in larger established companies, while others focus on smaller or faster-growing businesses.
This can lead to very different outcomes.
A fund with a high weighting to Taiwan or South Korea may be more exposed to technology and semiconductor companies. A fund with a high weighting to India may behave differently from one focused on China. A fund that excludes China altogether may produce results that are very different from a traditional emerging markets index fund.
That is why sector averages are useful, but not enough on their own. They provide a benchmark for comparison, but they do not explain how each fund achieved its results.
5 Stronger Performing Global Emerging Market Funds
The following 5 funds were highlighted as stronger performers in the data. They are not recommendations, but they show how some funds have compared against the IA Global Emerging Markets sector average over the periods analysed.
Invesco Emerging Markets ex China (UK) Z Acc
Invesco Emerging Markets ex China (UK) Z Acc was the strongest highlighted fund over 5 years. It returned 76.14% over 1 year, 113.76% over 3 years and 170.90% over 5 years.
Its rankings were also strong. The fund ranked 6th out of 173 funds over 1 year, 6th out of 160 over 3 years and 1st out of 149 over 5 years.
Those figures were well ahead of the sector averages of 50.53%, 72.59% and 49.98%.
The most important point is the fund’s focus. This is an emerging markets fund that excludes China. That has been a significant differentiator. While many traditional emerging market funds carry meaningful China exposure, this fund has taken a different route. Over the periods analysed, that approach has delivered a very strong relative outcome.
For investors, the lesson is not that excluding China will always work. It is that country exposure matters. Two emerging markets funds can sit in the same sector but have very different regional profiles, which can lead to very different returns.
Carmignac Portfolio Asia Discovery FW GBP
Carmignac Portfolio Asia Discovery FW GBP Acc delivered one of the strongest all-round records in the review. It returned 77.01% over 1 year, 125.79% over 3 years and 117.78% over 5 years.
The fund ranked 3rd out of 173 funds over 1 year, 2nd out of 160 over 3 years and 4th out of 149 over 5 years.
This is a particularly strong set of rankings because the fund remained near the top of the sector across all three main periods. It was not just a short-term performer. It also ranked strongly over 3 and 5 years.
The fund’s Asia focus is important. It is not a broad emerging markets fund in the same way as a traditional global emerging markets index fund. Its results show how a more focused regional approach can deliver strong returns when the underlying markets and stock selection work well.
For investors, this fund highlights both opportunity and risk. The performance has been strong, but the regional focus means it should be assessed carefully within a wider portfolio to avoid becoming too concentrated in one part of emerging markets.
Ninety One Emerging Markets Equity
Ninety One Emerging Markets Equity I Acc was the only highlighted stronger performer with a 5-star Yodelar rating. It returned 67.18% over 1 year, 116.25% over 3 years and 76.32% over 5 years.
Its sector rankings were 22nd out of 173 funds over 1 year, 3rd out of 160 over 3 years and 20th out of 149 over 5 years.
The fund’s strongest relative period was 3 years, where it returned 116.25% compared with the sector average of 72.59%. Its 5-year return was also well ahead of the sector average of 49.98%.
This fund stands out because it has been competitive across more than one timeframe. It did not lead the sector over 1 year or 5 years, but it remained firmly ahead of the average and ranked particularly strongly over 3 years.
For investors, this is the type of fund where consistency of sector ranking is as important as the headline return. It shows a fund that has remained competitive without relying solely on one standout period.
Baillie Gifford Emerging Markets Leading Companies B Acc
Baillie Gifford Emerging Markets Leading Companies B Acc GBP delivered strong returns across the periods analysed. It returned 71.27% over 1 year, 90.10% over 3 years and 53.92% over 5 years.
The fund ranked 10th out of 173 funds over 1 year, 28th out of 160 over 3 years and 54th out of 149 over 5 years.
Its 1-year return was particularly strong, sitting well ahead of the sector average of 50.53%. The 3-year return was also ahead of the sector average of 72.59%. The 5-year return remained above average, but the ranking was less dominant than the shorter periods.
That tells a useful story. The fund has performed well, but its strongest relative performance came over 1 year. Investors looking at this fund should therefore consider both the recent strength and the more moderate 5-year sector ranking.
A fund can be ahead of average and still not rank among the very top over every period. That is why looking at both returns and sector rankings matters.
HSBC Global Emerging Markets Equity BC GBP
HSBC Global Emerging Markets Equity BC GBP returned 63.65% over 1 year, 86.64% over 3 years and 53.20% over 5 years.
It ranked 31st out of 173 funds over 1 year, 38th out of 160 over 3 years and 56th out of 149 over 5 years.
The fund was ahead of the sector average across all three periods. Its strongest relative results came over 1 and 3 years, while its 5-year return was only modestly ahead of the sector average of 49.98%.
This is not the most eye-catching fund in the stronger group, but it has still compared well against the sector over each of the periods analysed. That matters because not every strong fund needs to sit at the very top of the table. Some funds stand out because they remain consistently ahead of the average.
For investors, the key question is whether that level of consistency is enough, and whether the fund adds something useful to the wider portfolio.

5 Weaker Performing Global Emerging Market Funds
The following funds were highlighted as weaker performers. This does not mean they will remain weak in future, and it does not automatically mean they are unsuitable for every investor. However, their returns and sector rankings show that they lagged the IA Global Emerging Markets sector average over the periods analysed.
Stewart Investors Global Emerging Markets All Cap B
Stewart Investors Global Emerging Markets All Cap B GBP Acc was one of the weakest highlighted funds across all three periods. It returned 13.95% over 1 year, 11.53% over 3 years and 6.28% over 5 years.
Its rankings were 170th out of 173 funds over 1 year, 157th out of 160 over 3 years and 145th out of 149 over 5 years.
Those figures were significantly below the sector averages of 50.53%, 72.59% and 49.98%.
The scale of the gap is important. Over 5 years, the fund returned 6.28%, compared with a sector average of 49.98%. That means investors in this fund would have seen a positive return, but still been far behind the wider sector.
This is a clear example of why performance should be judged against sector peers, not just in isolation. A fund can make money and still lag badly.
Vanguard FTSE Emerging Markets UCITS ETF
Vanguard FTSE Emerging Markets UCITS ETF Inc USD returned 28.48% over 1 year, 52.44% over 3 years and 35.72% over 5 years.
It ranked 158th out of 173 funds over 1 year, 138th out of 160 over 3 years and 110th out of 149 over 5 years.
The fund was below the sector average across all three periods. Its 5-year return of 35.72% was below the sector average of 49.98%.
This fund is notable because Vanguard is a highly recognised provider and the ongoing charge was low at 0.17%. Low cost is important, but it does not guarantee strong relative performance. In this case, the fund lagged the sector across each of the main periods analysed.
For investors, the lesson is not that low-cost index funds are poor. It is that cost should be one part of the assessment, not the whole decision. The index being tracked, the regional exposure and the fund’s role in the portfolio all matter.
Pictet Emerging Markets
Pictet Emerging Markets I GBP returned 46.61% over 1 year, 62.46% over 3 years and 16.71% over 5 years.
Its sector rankings were 117th out of 173 funds over 1 year, 109th out of 160 over 3 years and 139th out of 149 over 5 years.
The fund’s 1-year and 3-year returns were below the sector averages of 50.53% and 72.59%, but the biggest concern in the data was the 5-year result. A return of 16.71% was well below the sector average of 49.98%.
This shows why longer-term comparisons can reveal issues that recent numbers may not fully show. The fund was not among the very weakest over 1 year, but its 5-year ranking placed it near the bottom of the sector.
For investors, that kind of pattern should prompt closer review. It may not require immediate action, but it does require understanding why the fund has lagged over the longer period.
TM Redwheel Global Emerging Markets Fund
TM Redwheel Global Emerging Markets Fund R Acc GBP returned 40.59% over 1 year, 53.14% over 3 years and 15.12% over 5 years.
It ranked 130th out of 173 funds over 1 year, 137th out of 160 over 3 years and 142nd out of 149 over 5 years.
The fund lagged the sector average across all three periods. The 5-year return was particularly weak compared with the sector average of 49.98%.
This fund is another example of how a global emerging markets label can hide very different outcomes. It was not the weakest fund over 1 year, but over 5 years it ranked close to the bottom of the sector.
That matters because many investors hold emerging market funds for long-term growth potential. If a fund is persistently lagging over multiple periods, it raises questions about whether it is still doing the job expected of it.
UBS Global Emerging Markets Equity C Acc
UBS Global Emerging Markets Equity C Acc returned 37.66% over 1 year, 57.10% over 3 years and 22.89% over 5 years.
Its rankings were 139th out of 173 funds over 1 year, 122nd out of 160 over 3 years and 132nd out of 149 over 5 years.
The fund was below the sector average across each of the main periods. The gap was clearest over 5 years, where the fund returned 22.89% compared with the sector average of 49.98%.
Again, this does not mean the fund cannot improve in future. But the historical data shows that it has not ranked competitively against its sector peers over the periods analysed.
For investors, this is the type of fund that should be reviewed in the context of the wider portfolio. If a holding has lagged its sector over several periods, it is worth understanding whether it still has a clear role.
What The Performance Gap Shows
The difference between the strongest and weakest highlighted funds is significant.
Over 5 years, Invesco Emerging Markets ex China (UK) Z Acc returned 170.90%, while Stewart Investors Global Emerging Markets All Cap returned 6.28%. Both sat in the IA Global Emerging Markets sector, but the outcomes were very different.
That does not mean the higher-returning fund will continue to outperform. It does show why investors should look beyond the sector label.
In emerging markets, fund results can be heavily influenced by country exposure, sector exposure, currency movements and investment style. A fund with strong exposure to the right region at the right time can move well ahead of the sector. A fund positioned in weaker areas can lag badly, even if the long-term investment case sounds reasonable.
This is why performance tables should not be used as a shortcut, but they can provide useful evidence. They show which funds have been more competitive, which have lagged, and where further review may be needed.

Why Emerging Market Funds Need Careful Portfolio Review
Emerging market funds are often used to add growth potential to a portfolio. That can be sensible for some investors, but the amount held and the type of fund chosen both matter.
A broad emerging markets tracker is very different from an Asia-focused fund. An ex-China fund is different from a traditional emerging markets fund. A fund with heavy technology exposure may behave differently from one focused on financials, consumer companies or commodities.
That means emerging market exposure should not be judged in isolation.
A portfolio may already have indirect exposure to emerging markets through global funds, Asia funds or specialist technology funds. Adding another emerging markets fund may improve diversification, but it could also increase concentration if it overlaps with existing holdings.
This is where a portfolio analysis can provide useful clarity. It can show how each fund has performed, how it ranks within its sector, and whether the wider portfolio has unintended overlaps, regional concentration or gaps in diversification.
For self-managed investors, this can be particularly helpful. It is one thing to pick a fund that looks strong on a performance table. It is another to know whether it improves the portfolio as a whole.

Where Advice And Portfolio Management Can Help
Many self-managed investors are confident choosing funds. They compare charges, read factsheets and look at recent performance. That can be useful, but it does not always show whether the overall portfolio is structured effectively.
Professional advisers and portfolio managers can add value by looking at the bigger picture. This includes fund quality, risk level, diversification, overlap, asset allocation and how the portfolio should be maintained over time.
For some investors, professionally managed portfolios such as those from MKC Invest may provide a more structured approach. MKC Invest portfolios are managed within defined risk frameworks and use research, fund analysis and ongoing oversight to help maintain portfolio structure over time.
Because MKC Invest has discretionary permissions, portfolio changes can be made within an agreed mandate without requiring approval for each individual adjustment. This can help portfolios remain reviewed and aligned as markets, fund quality and opportunities change.
This does not guarantee better returns and it will not be suitable for everyone. But for investors who do not want to manage every fund decision themselves, it can provide a more structured way to keep a portfolio reviewed, diversified and aligned to its long-term purpose.
The starting point is understanding what is already held, how each fund has performed, and whether the portfolio still matches the investor’s objectives.

Conclusion
The IA Global Emerging Markets sector can offer access to areas of the world with strong long-term growth potential, but this review shows how much outcomes can vary.
The strongest highlighted funds were not just slightly ahead of the sector. In some cases, they were significantly ahead. Invesco Emerging Markets ex China ranked 1st over 5 years, Carmignac Portfolio Asia Discovery ranked 2nd over 3 years and 4th over 5 years, and Ninety One Emerging Markets Equity achieved a 5-star Yodelar rating.
At the other end, several funds lagged the sector average across 1, 3 and 5 years. Some still produced positive returns, but they were well behind their peer group.
That is why investors should avoid treating emerging markets as a single decision. The sector is broad, complex and highly varied. Fund selection matters, but so does the role each fund plays within the wider portfolio.
Past performance should not be used as the sole basis for investment decisions. But it can help identify whether a fund has been competitive, whether it has lagged, and whether it deserves closer review.
For investors already holding emerging market funds, the most useful question may not be which fund has delivered the highest return. It is whether the fund held is doing the job it is meant to do, and whether the portfolio around it remains properly structured.


