

-
We reviewed 44 M&G funds using performance figures to 30th October 2026. Forty had a complete five year performance record.
-
Among those 40 funds, 22.5% received a 4 or 5 star Yodelar Rating, while 47.5% received a 1 or 2 star rating.
-
M&G Japan recorded the highest five year growth in the reviewed range at 102.33%, ranking seventh out of 87 funds in its sector.
-
M&G Global Strategic Value also ranked competitively across one, three and five years, with five year growth of 98.52%.
-
Several funds combined stronger recent results with weaker longer term rankings, showing why neither a single return figure nor a rating should be considered in isolation.
M&G has been managing investments since 1931, building a fund range that covers global equities, bonds and multi asset investing. For investors researching the provider, there is plenty of choice. The more important question is which funds have delivered competitive performance and which have fallen behind.
Our latest review shows a mixed picture. Several M&G funds have ranked strongly against sector peers, while others have struggled over longer periods despite more encouraging recent returns. These differences matter: a positive return can look reassuring without revealing how much better competing funds performed over the same period.
In this report, we examine the performance, sector rankings and Yodelar Ratings of 44 M&G funds. Whether you already hold M&G funds or are considering investing in them, this review provides a clear view of how they have compared with other funds in the same Investment Association (IA) sectors, highlighting both stronger records and areas that warrant closer attention.

M&G Fund Performance Summary
Among the 40 M&G funds with five year records, nine received a 4 or 5 star Yodelar Rating, representing 22.5%. Nineteen received a 1 or 2 star rating, representing 47.5%. The remaining 12 received a 3 star rating. Four funds without five year figures in the supplied report are excluded from this summary.
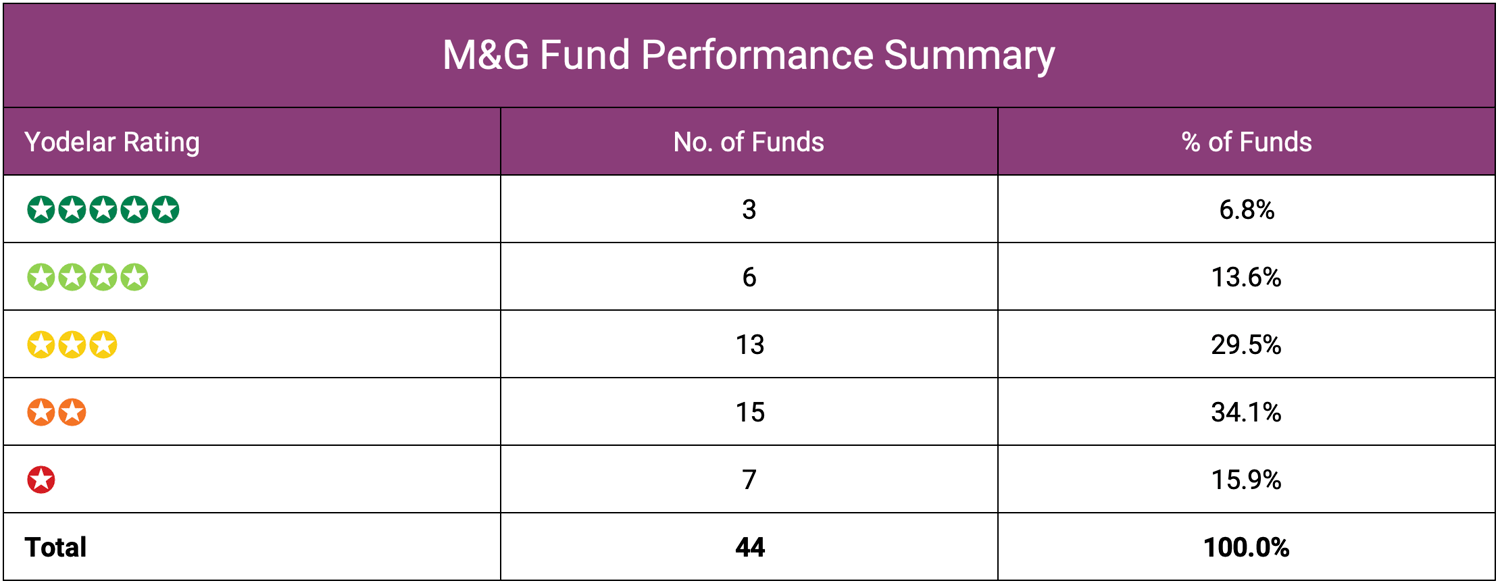
Performance figures up to 30th October 2026. Source: hub.yodelar.com. Past performance is not a guide to future returns.
How Yodelar Rates Fund Performance
Five Highest Returning M&G Funds
The following funds recorded the highest five year growth figures among the M&G funds reviewed. They invest in different markets, so their own sector rankings provide important context. The order does not account for differences in risk or establish which fund would suit an individual investor.
|
Fund |
IA sector |
1 year growth |
3 year growth |
5 year growth |
5 year sector rank |
Yodelar Rating |
|---|---|---|---|---|---|---|
|
M&G Japan I Acc GBP |
IA Japan |
23.33% |
76.74% |
102.33% |
7/87 |
5 stars |
|
M&G Global Strategic Value I Acc GBP |
IA Global |
17.65% |
76.71% |
98.52% |
21/426 |
5 stars |
|
M&G North American Value I Acc GBP |
IA North America |
21.43% |
66.93% |
89.89% |
20/214 |
4 stars |
|
M&G Asian I Acc GBP |
IA Asia Pacific Excluding Japan |
18.92% |
88.95% |
87.45% |
10/99 |
4 stars |
|
M&G Global Dividend I Acc GBP |
IA Global Equity Income |
19.08% |
70.98% |
78.35% |
11/51 |
4 stars |
Performance figures up to 30th October 2026. Source: hub.yodelar.com. Past performance is not a guide to future returns.
M&G Japan
M&G Japan recorded five year growth of 102.33%, the highest figure in the reviewed M&G range and seventh out of 87 funds in the IA Japan sector. Its three year growth of 76.74% ranked 11th out of 92, while its one year result of 23.33% placed 17th out of 97. The fund received a 5 star Yodelar Rating.
The strategy focuses on understanding individual businesses and assessing whether their share prices fairly reflect their prospects and risks. M&G describes an approach that can include different types of companies, rather than following a fixed preference for either fast growing businesses or cheaper shares. For investors, the competitive sector positions extended across all three periods, although a dedicated Japan fund still serves a different purpose from a broadly spread global portfolio.
M&G Global Strategic Value
M&G Global Strategic Value recorded five year growth of 98.52%, ranking 21st out of 426 funds in the IA Global sector. Its three year growth of 76.71% placed 45th out of 483, while its one year result of 17.65% ranked 55th out of 543. It received a 5 star Yodelar Rating.
The fund looks for companies whose shares appear inexpensive compared with the value of their businesses. Its research aims to distinguish an overlooked opportunity from a company that is cheap because its prospects are deteriorating. This gives it a different approach from a global tracker, with results depending on the companies selected and whether the manager’s assessment proves correct.
M&G North American Value
M&G North American Value recorded five year growth of 89.89%, ranking 20th out of 214 funds in the IA North America sector. Its one year growth of 21.43% ranked 25th out of 261. The three year result was less competitive, with growth of 66.93% placing 112th out of 232.
The strategy invests mainly in companies based in, or conducting most of their business in, the US and Canada. It seeks businesses that are out of favour or whose share prices the manager believes underestimate their value. The one and five year rankings were strong, but the more middle ranking three year position shows why the full record deserves attention.
M&G Asian
M&G Asian recorded five year growth of 87.45%, ranking tenth out of 99 funds in the IA Asia Pacific Excluding Japan sector. Its three year growth of 88.95% ranked 16th out of 104. Over one year, growth of 18.92% placed 46th out of 107, giving it a less prominent recent position than its longer term rankings.
The managers research individual businesses across Asia Pacific excluding Japan, looking for differences between what they believe a company is worth and its market price. For investors, the longer term results remain competitive, but they should not obscure the more modest recent ranking. The fund’s regional focus should also be considered alongside any Asian exposure already held elsewhere.
M&G Global Dividend
M&G Global Dividend recorded five year growth of 78.35%, ranking 11th out of 51 funds in the IA Global Equity Income sector. Its three year growth of 70.98% also ranked 11th, while its one year result of 19.08% placed 15th out of 59. It received a 4 star Yodelar Rating.
The strategy focuses on companies with the potential to grow their dividends, rather than simply selecting shares offering the highest income today. It combines businesses with different sources of dividend growth. That explains its income approach, but the performance table does not separately establish how much income was distributed or how consistent those payments were.

Three Records Worth Examining More Closely
The following funds illustrate different reasons for reviewing an existing holding. They are selected examples with lower Yodelar Ratings, not the three lowest returning M&G funds.
|
Fund |
IA sector |
1 year growth |
3 year growth |
5 year growth |
5 year sector rank |
Yodelar Rating |
|---|---|---|---|---|---|---|
|
M&G Global Macro Bond I Acc GBP |
IA Global Mixed Bond |
-1.53% |
3.61% |
-5.36% |
62/80 |
1 star |
|
M&G Positive Impact R Acc |
IA Global |
11.85% |
36.37% |
18.46% |
341/426 |
1 star |
|
M&G Optimal Income I Acc GBP |
IA Sterling Strategic Bond |
-1.25% |
20.22% |
11.26% |
30/70 |
2 stars |
Performance figures up to 30th October 2026. Source: hub.yodelar.com. Past performance is not a guide to future returns.
M&G Global Macro Bond
M&G Global Macro Bond recorded a five year loss of 5.36%, ranking 62nd out of 80 funds in the IA Global Mixed Bond sector. Its three year growth of 3.61% ranked 78th out of 93, compared with a sector average of 8.82%.
The one year result needs different treatment. Although the fund lost 1.53%, that was slightly less than the sector’s average loss of 1.62%. The concern is therefore not that it performed poorly against every comparison, but that its longer term record remained weaker than many competing funds.
For an existing investor, that distinction provides a more useful starting point than either dismissing the fund because it lost money or excusing its entire record because bond markets have been difficult.
M&G Positive Impact
M&G Positive Impact recorded five year growth of 18.46%, ranking 341st out of 426 IA Global funds. Its three year growth of 36.37% placed 386th out of 483.
Its more recent results were stronger. One year growth of 11.85% exceeded the sector average of 8.89%, while six month growth of 10.15% ranked 66th out of 553 funds. Those results deserve recognition, even though the three and five year positions remained weaker.
The fund combines a financial objective with an intention to support positive environmental or social outcomes. The figures in this review assess its investment performance, not whether those wider objectives were achieved. Investors who selected it for both purposes should review both, rather than assume that one replaces the need to assess the other.
M&G Optimal Income
M&G Optimal Income recorded five year growth of 11.26%, ranking 30th out of 70 funds in the IA Sterling Strategic Bond sector. Its three year growth of 20.22% placed 38th out of 76. The one year result was weaker, with a loss of 1.25% ranking 73rd out of 85.
There is also a policy change to consider. On 7th May 2026, M&G removed the fund’s ability to actively invest in shares and increased its minimum bond allocation from 50% to 70%. M&G stated that this clarified the fund’s existing focus and would not immediately change the portfolio or materially alter its risk profile. The longer performance figures span the earlier and revised policies.
The result is a mixed record rather than uniformly weak performance. Its recent sector position warrants attention, but the five year result should not be described as among the weakest in its sector.

The Highest Growth Table Does Not Tell You Everything
M&G Short Dated Corporate Bond recorded five year growth of 19.69%, considerably below the equity funds in the first table. Yet it ranked second out of 85 funds in the IA Sterling Corporate Bond sector.
It also ranked first over one year, with growth of 2.70%, although its three year growth of 17.19% placed 45th out of 88 funds. Its supplied Yodelar Rating was 3 stars.
This is a useful example of why the return, sector ranking and rating should be read together. The five year figure was lower than those of the equity funds, but highly competitive within its own sector. At the same time, its three year position was less convincing than its one and five year rankings.
Replacing a bond fund solely to pursue a higher historic equity return would also change the investment mix. The relevant question is whether the holding has performed competitively for its role and whether that role remains appropriate.
Download The Updated M&G Fund Report
The complete report covers all 44 M&G funds reviewed. It includes available performance figures, sector rankings, sector averages and Yodelar Ratings across periods from one month to five years.

Get A Free Portfolio Analysis
Your M&G funds are only part of the picture. Our free portfolio analysis reviews available one, three and five year performance, sector rankings and Yodelar Ratings across the investments you hold. Where information is available, it can also highlight possible duplication and concentration.
Upload a recent portfolio statement or provide your fund names and approximate values. The analysis provides factual information, not personal advice or a recommendation to buy, sell or switch. There is no obligation to make changes or proceed with advice.
Upload Your Portfolio For Free Analysis
Speak To An Adviser
To discuss the findings alongside your retirement plans, income needs or other objectives, book a no obligation call with an adviser from our advice partner, MKC Wealth.
Any personal recommendation would follow a fuller assessment of your circumstances, objectives, attitude to risk and ability to withstand losses. The risks, costs and ongoing services would be explained before you decide whether to proceed.
Book A No Obligation Call
Summary
The latest M&G figures show several competitive records, but also meaningful differences between the funds reviewed. M&G Japan and Global Strategic Value ranked strongly across the main periods, while other funds combined stronger recent results with less convincing longer term positions.
The lower returning bond example is equally important. A fund does not need to appear at the top of a provider’s growth table to have delivered a competitive result within its own sector.
For investors, the useful conclusion is not to favour or avoid M&G as a whole. It is to examine the funds actually held, understand what their records show and assess whether their roles still make sense. The full report provides the individual fund evidence; a portfolio analysis brings those holdings together before the next decision is made.