


-
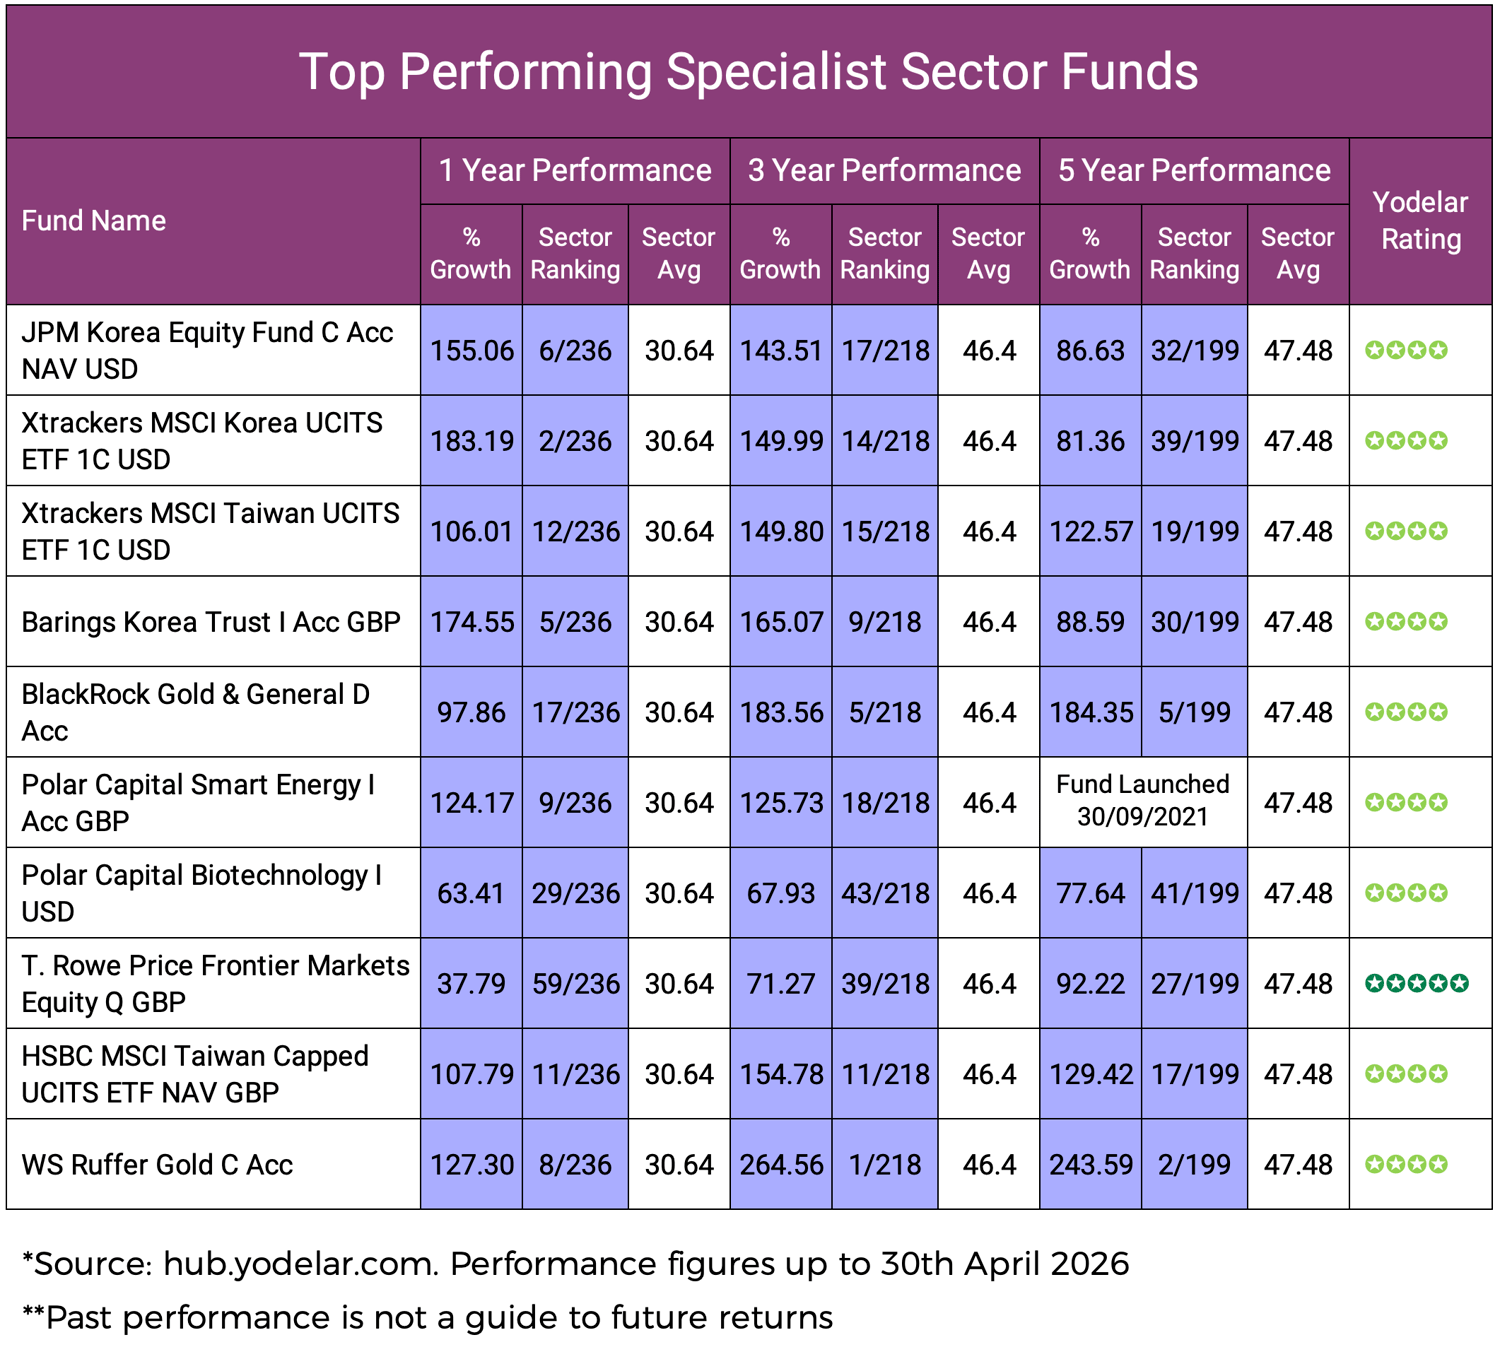
The IA Specialist sector contains 236 funds across a wide range of markets, themes and strategies
-
The sector average return was 30.64% over one year, 46.40% over three years and 47.48% over five years
-
Only 6 funds achieved a 5 star Yodelar rating, equal to 2.5% of the sector
- The 10 featured funds all ranked strongly over the periods analysed, but they invest in very different areas
-
Specialist funds can add useful variety to a portfolio.
The IA Specialist sector is one of the more difficult sectors for investors to assess. Unlike a UK equity fund sector or a global fund sector, where funds often invest in broadly similar areas, the specialist sector contains a much wider range of funds. Some focus on a single country such as Korea or Taiwan. Others focus on a theme such as biotechnology, gold, smart energy or frontier markets.
That makes the sector both interesting and difficult to compare. A fund investing in Korean technology companies is not doing the same job as a fund investing in gold miners, even if both sit in the same Investment Association (IA) sector. The Investment Association’s wider sector framework is designed to group funds by asset type, region or industry, while specialist categories can contain funds that do not fit neatly into mainstream areas. Independent sector guidance also notes that direct comparisons across the whole IA Specialist sector need care because of the diverse nature of the funds included.
This is why the IA Specialist sector should not be treated as a simple league table. Performance rankings are still useful, but investors need to understand what each fund actually holds, what role it may play, and whether it adds something useful to the wider portfolio.

IA Specialist Sector Performance Summary
The IA Specialist sector delivered strong average returns over the periods analysed, with the average fund returning 30.64% over one year, 46.40% over three years and 47.48% over five years. But those averages hide a wide spread in fund quality.
What The Yodelar Rating Table Shows
The Yodelar ratings shown below are the findings from our review, rather than the full performance data for each fund. The review covered IA Specialist sector fund performance over the one, three and five year periods to 30 April 2026, where data was available.
| Yodelar Fund Rating | Number of Funds | Percentage of Funds |
|---|---|---|
| 5 star | 6 | 2.5% |
| 4 star | 42 | 17.8% |
| 3 star | 34 | 14.4% |
| 2 star | 83 | 35.2% |
| 1 star | 71 | 30.0% |
| Total | 236 | 100.0% |
Only 48 of the 236 funds analysed achieved a 4 or 5 star Yodelar rating. At the other end, 154 funds were rated either 1 or 2 stars, meaning almost two thirds of the sector sat among the weaker performers.
That matters because specialist funds are often bought for a specific reason. Investors may want exposure to gold, healthcare, technology, energy transition, Korea, Taiwan or smaller developing markets. But choosing the wrong fund within a specialist area can still lead to much weaker returns than the best options available.
Download the full IA Specialist Sector Fund Performance Report
10 Top Performing IA Specialist Funds
The following funds were selected from the IA Specialist sector data because they ranked strongly across the periods analysed. Each fund has a different focus, so the figures should be viewed in context. A Korean fund, a gold fund and a biotechnology fund are not interchangeable, even if they are listed in the same sector.
JPM Korea Equity Fund C Acc
JPM Korea Equity Fund returned 155.06% over one year, ranking 6th out of 236 funds, compared with the sector average of 30.64%. Over three years it returned 143.51%, ranking 17th out of 218, and over five years it returned 86.63%, ranking 32nd out of 199. The fund’s annual ongoing charge is 0.96%.
This is a manager run fund focused on Korean companies. Its latest fact sheet describes the fund as investing mainly in a concentrated portfolio of Korean businesses, with top holdings including SK Hynix, Samsung Electronics, SK Square, Samsung Electro Mechanics, Shinhan Financial, Hyundai Motor and Kia.
The performance has been driven by very strong returns from South Korean companies, particularly in technology and semiconductors. The fund has been well ahead of the sector average over one, three and five years, but investors should remember that this is still a single country fund and will be heavily influenced by Korean market conditions.
Xtrackers MSCI Korea UCITS ETF
Xtrackers MSCI Korea returned 183.19% over one year, ranking 2nd out of 236 funds. Over three years it returned 149.99%, ranking 14th out of 218, and over five years it returned 81.36%, ranking 39th out of 199. Its annual ongoing charge is 0.45%, making it one of the lower cost funds in the group.
This is a market tracking fund, which means it follows an index rather than relying on a manager to select individual companies. The fund tracks the MSCI Korea 20/35 Custom Index and is designed to reflect large and medium sized companies listed in South Korea.
Its largest holdings show why performance has been so strong. Samsung Electronics and SK Hynix alone made up a large part of the fund, with other holdings including Hyundai Motor, KB Financial, SK Square, Hanwha Aerospace, Doosan Enerbility and Kia. This gives investors simple exposure to Korea, but it also means the fund is very dependent on a small number of major companies.
Xtrackers MSCI Taiwan UCITS ETF
Xtrackers MSCI Taiwan returned 106.01% over one year, ranking 12th out of 236 funds. Over three years it returned 149.80%, ranking 15th out of 218, and over five years it returned 122.57%, ranking 19th out of 199. Its annual ongoing charge is 0.65%.
This is another market tracking fund, but its focus is Taiwan. The fund tracks the MSCI Taiwan 20/35 Custom Index and gives investors exposure to large and medium sized Taiwanese companies.
The fund is heavily influenced by technology and semiconductor companies. Its largest holding is Taiwan Semiconductor Manufacturing Company, followed by names such as Delta Electronics, Hon Hai Precision, MediaTek, ASE Technology, Elite Material, Accton Technology and Quanta Computer. This has been a powerful source of returns, but it also means investors are taking clear Taiwan and technology exposure.

Barings Korea Trust
Barings Korea Trust returned 174.55% over one year, ranking 5th out of 236 funds. Over three years it returned 165.07%, ranking 9th out of 218, and over five years it returned 88.59%, ranking 30th out of 199. Its annual ongoing charge is 0.99%.
The fund invests in Korean companies and aims to provide returns above the Korean stock market over rolling five year periods. Barings states that the fund invests at least 70% of its assets in companies incorporated in Korea, operating mainly in Korea, or listed on Korean exchanges.
The fund’s recent holdings included Samsung Electronics, SK Hynix, SK Square, Samsung Electro Mechanics, HD Hyundai Electric and Doosan Enerbility. This gives it a clear Korea focus, but unlike a tracker fund, the manager has more control over which companies to own and how much to allocate to each.
BlackRock Gold & General
BlackRock Gold & General returned 97.86% over one year, ranking 17th out of 236 funds. Over three years it returned 183.56%, ranking 5th out of 218, and over five years it returned 184.35%, ranking 5th out of 199. Its annual ongoing charge is 1.15%.
This fund is very different from the Korea and Taiwan funds. It invests mainly in companies linked to gold mining and precious metals. BlackRock states that the fund invests at least 70% of its assets in companies that earn a significant part of their income from gold mining or commodities such as precious metals.
The largest holdings included Barrick Mining, Newmont, AngloGold Ashanti, Wheaton Precious Metals, Northern Star Resources, Kinross Gold, Endeavour Mining and Franco Nevada. The fund has delivered very strong five year returns, but BlackRock also highlights that mining shares can be more volatile than other investments and that investing in a limited number of sectors can increase risk.
Polar Capital Smart Energy
Polar Capital Smart Energy returned 124.17% over one year, ranking 9th out of 236 funds. Over three years it returned 125.73%, ranking 18th out of 218. The supplied data did not include a full five year return for this fund, so it should be assessed mainly on its shorter and medium term record. Its annual ongoing charge is 0.91%.
The fund focuses on companies linked to cleaner and more efficient energy use. Its objective is long term growth, with a sustainability objective linked to companies supporting the decarbonisation and electrification of the global energy sector.
Recent holdings included Coherent, Lumentum, Marvell Technology, Analog Devices, Renesas Electronics, Delta Electronics, Hydro One, Siemens Energy, LG Energy Solution and STMicroelectronics. This gives the fund exposure to technology, energy infrastructure and electrification, but investors should recognise that this is a focused theme and can move sharply when sentiment changes.
Polar Capital Biotechnology
Polar Capital Biotechnology returned 63.41% over one year, ranking 29th out of 236 funds. Over three years it returned 67.93%, ranking 43rd out of 218, and over five years it returned 77.64%, ranking 41st out of 199. Its annual ongoing charge is 1.10%.
The fund invests in biotechnology, diagnostics and life sciences companies across different countries. Polar Capital describes the fund as aiming to preserve capital and achieve long term growth by investing across the biotechnology ecosystem.
Recent holdings included Argenx, Revolution Medicines, Xenon Pharmaceuticals, AstraZeneca, Madrigal Pharmaceuticals, Ascendis Pharma and Regeneron. Biotechnology funds can offer access to areas of medical innovation that are not always strongly represented in mainstream global funds, but they can also be sensitive to drug trial results, regulation and changes in investor confidence.
T. Rowe Price Frontier Markets Equity
T. Rowe Price Frontier Markets Equity returned 37.79% over one year, ranking 59th out of 236 funds. Over three years it returned 71.27%, ranking 39th out of 218, and over five years it returned 92.22%, ranking 27th out of 199. It was the only fund in this featured group with a 5 star Yodelar rating, and its annual ongoing charge is 1.13%.
This fund invests in frontier markets, which are smaller and less developed than the major global stock markets. T. Rowe Price describes the strategy as a manager run portfolio of around 50 to 80 companies across frontier markets, aimed at long term growth.
Recent holdings included companies such as Banca Transilvania, Hoa Phat Group, Kaspi.kz, Asia Commercial Bank, Attijariwafa Bank and Nova Ljubljanska Banka. This fund can give investors exposure to countries and companies they are unlikely to hold elsewhere, but frontier markets can be more volatile, less liquid and more sensitive to political and currency risks.

HSBC MSCI Taiwan Capped UCITS ETF
HSBC MSCI Taiwan Capped UCITS ETF returned 107.79% over one year, ranking 11th out of 236 funds. Over three years it returned 154.78%, ranking 11th out of 218, and over five years it returned 129.42%, ranking 17th out of 199. Its annual ongoing charge is 0.50%.
The fund aims to replicate the MSCI Taiwan Capped Index while keeping its performance as close as possible to that index. The index is designed to measure large and medium sized Taiwanese companies, with limits applied to manage the weight of the largest companies.
The largest holding was Taiwan Semiconductor Manufacturing Company, with other key holdings including MediaTek, Delta Electronics, Hon Hai Precision, ASE Technology and Elite Material. The fund has performed strongly, but it remains a focused Taiwan fund and is heavily influenced by the technology sector.
WS Ruffer Gold
WS Ruffer Gold returned 127.30% over one year, ranking 8th out of 236 funds. Over three years it returned 264.56%, ranking 1st out of 218, and over five years it returned 243.59%, ranking 2nd out of 199. Its annual ongoing charge is 1.25%.
The fund aims to provide capital growth by investing in gold and precious metal companies in the mining industry. Ruffer notes that the fund is no longer available for purchase through third party platforms, which is an important practical point for investors reviewing access.
The portfolio has been heavily exposed to gold related companies, with FT data showing most of the fund in non UK shares and a very high allocation to basic materials. This is not a defensive cash alternative. It is a focused gold mining fund, and the strong recent returns should be viewed alongside the higher risk that comes with such a narrow area of the market.
What The Strongest Specialist Funds Have In Common
The 10 funds above are very different, but there are some common themes. Many are focused on areas that have performed strongly in recent periods, including Korea, Taiwan, gold, biotechnology and energy transition. Several are also quite concentrated, meaning a small number of companies or one market can have a large effect on performance.
That concentration can help returns when the area is performing well. It can also hurt returns when the same area falls out of favour. This is why specialist funds should usually be used as part of a broader portfolio rather than as the core holding for most investors.
There is also a clear difference in cost. The lower cost tracker funds, such as Xtrackers MSCI Korea and HSBC MSCI Taiwan Capped, have delivered very strong returns with lower annual charges. Some of the manager run funds cost more, but have also produced strong results in specific areas such as gold, Korea and frontier markets. The important point is that cost should be assessed alongside performance, risk and the role of the fund.
Benefits And Drawbacks Of Specialist Funds
Specialist funds can be useful because they give investors access to areas that may not be well represented in a standard global portfolio. A broad global fund may include some exposure to Taiwan, Korea, healthcare, energy transition or gold related companies, but often not enough to make a meaningful difference when those areas perform strongly.
They can also help diversify a portfolio when used carefully. Gold funds, biotechnology funds and frontier market funds may behave differently from mainstream global funds. That can be helpful, but only when the portfolio is properly constructed and the position size is sensible.
The drawback is that specialist funds can be much more unpredictable. A single country fund depends heavily on that country. A gold fund depends heavily on gold mining companies. A biotechnology fund can be affected by regulation, clinical results and sentiment towards healthcare innovation. These funds can add value, but they can also increase risk if they are used without a clear purpose.

Summary
The IA Specialist sector has delivered strong average returns, but the sector is not straightforward. It contains 236 funds investing across very different areas, and the gap between stronger and weaker funds has been significant.
The funds featured in this review have ranked strongly across the periods analysed. Korea, Taiwan and gold related funds have been particularly prominent among the top performers, while selected biotechnology, smart energy and frontier market funds have also produced strong returns.
The key lesson is not that investors should simply buy specialist funds. It is that specialist funds need to be understood properly. They can add useful exposure to a portfolio, but they can also create too much concentration if they overlap with holdings already in place or if too much is allocated to one narrow theme.
Why A Yodelar Portfolio Analysis Can Help
Most investors do not hold specialist funds in isolation. They hold them alongside global funds, pension funds, ISA holdings, managed portfolios and other investments accumulated over time. This is where the real question becomes more important: does the specialist fund improve the portfolio, or does it simply add more risk?
A Yodelar portfolio analysis reviews each fund against its sector, looks at how holdings compare, and helps identify whether a portfolio is properly balanced. It can highlight weaker funds, overlapping holdings, high charges and areas where the portfolio may be too dependent on one region, market or theme.
For investors who already hold specialist funds, or are considering adding them, this kind of review can provide a clearer starting point. The aim is not to chase the latest top performing area. It is to understand whether each fund has a clear role and whether the overall portfolio is working as it should.
Book a no obligation call with an FCA regulated adviser to review your portfolio and understand whether your current funds remain aligned with your objectives and attitude to risk.


