


-
The IA Asia Pacific ex Japan sector returned an average of 46.46% over one year, 51.28% over three years and 32.87% over five years
-
HSBC Pacific Index C Acc ranked 1st over one year with 87.04%, while IFSL Marlborough Far East Growth P Inc ranked 1st over three years with 101.99%
-
Royal London Asia Pacific ex Japan Equity Tilt Z Acc returned 86.99% over five years, the 2nd highest return in the sector
-
Several of the strongest funds were low cost funds that simply follow the market, showing how difficult that approach has been to beat
Asia Pacific ex Japan is a sector some investors may have overlooked in recent years. It has not always been the first place people look when reviewing their ISA, pension or investment account. But the latest numbers show it is a sector that deserves far more attention.
The returns have been strong. Very strong. The average fund in the IA Asia Pacific ex Japan sector returned 46.46% over one year, 51.28% over three years and 32.87% over five years. Those are already eye catching sector averages. But the strongest funds were well ahead of them.
That is what makes this sector worth reviewing closely. On the surface, two funds in the same sector can look similar. In reality, the returns investors received have been very different. Some funds have surged ahead. Others have been far less impressive. So this is not simply a story about a strong part of the market. It is also a story about why fund selection still matters.
Below are 10 funds that have stood out based on the figures provided. Each delivered returns above the sector average over one, three and five years.
Asian Equity Funds Performance Summary
Out of 108 funds in the IA Asia Pacific ex Japan sector, only 2 achieved a 5-star Yodelar rating. A further 19 were rated 4 stars.
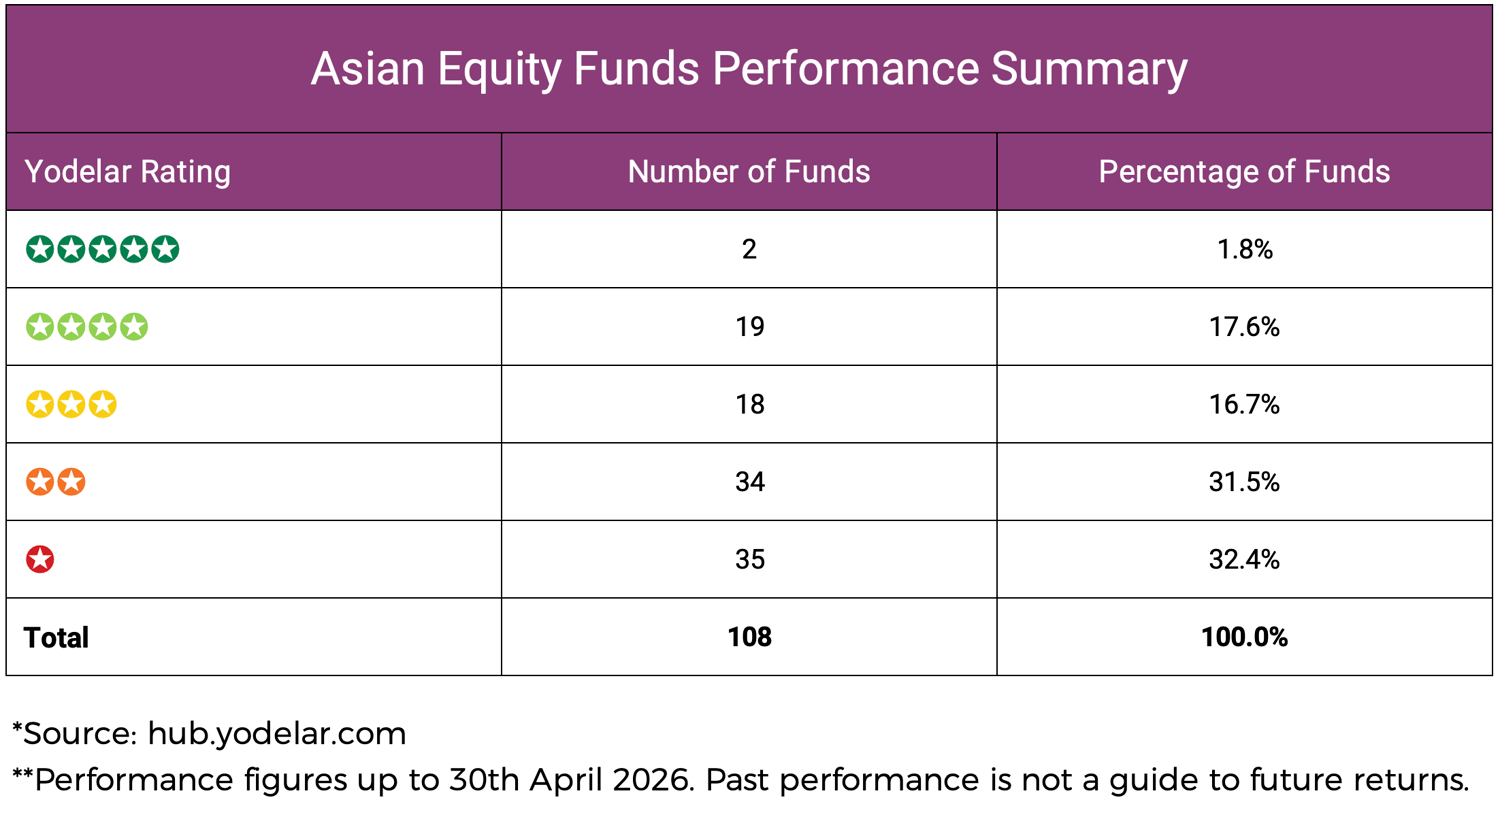
At the other end, 69 funds were rated either 1 or 2 stars, meaning the majority ranked in the lower half of the sector across the periods analysed.
10 Top Performing Asian Equity Funds
The 10 funds featured in this article have consistently been among the top performers in the IA Asia Pacific ex Japan sector over the periods analysed.
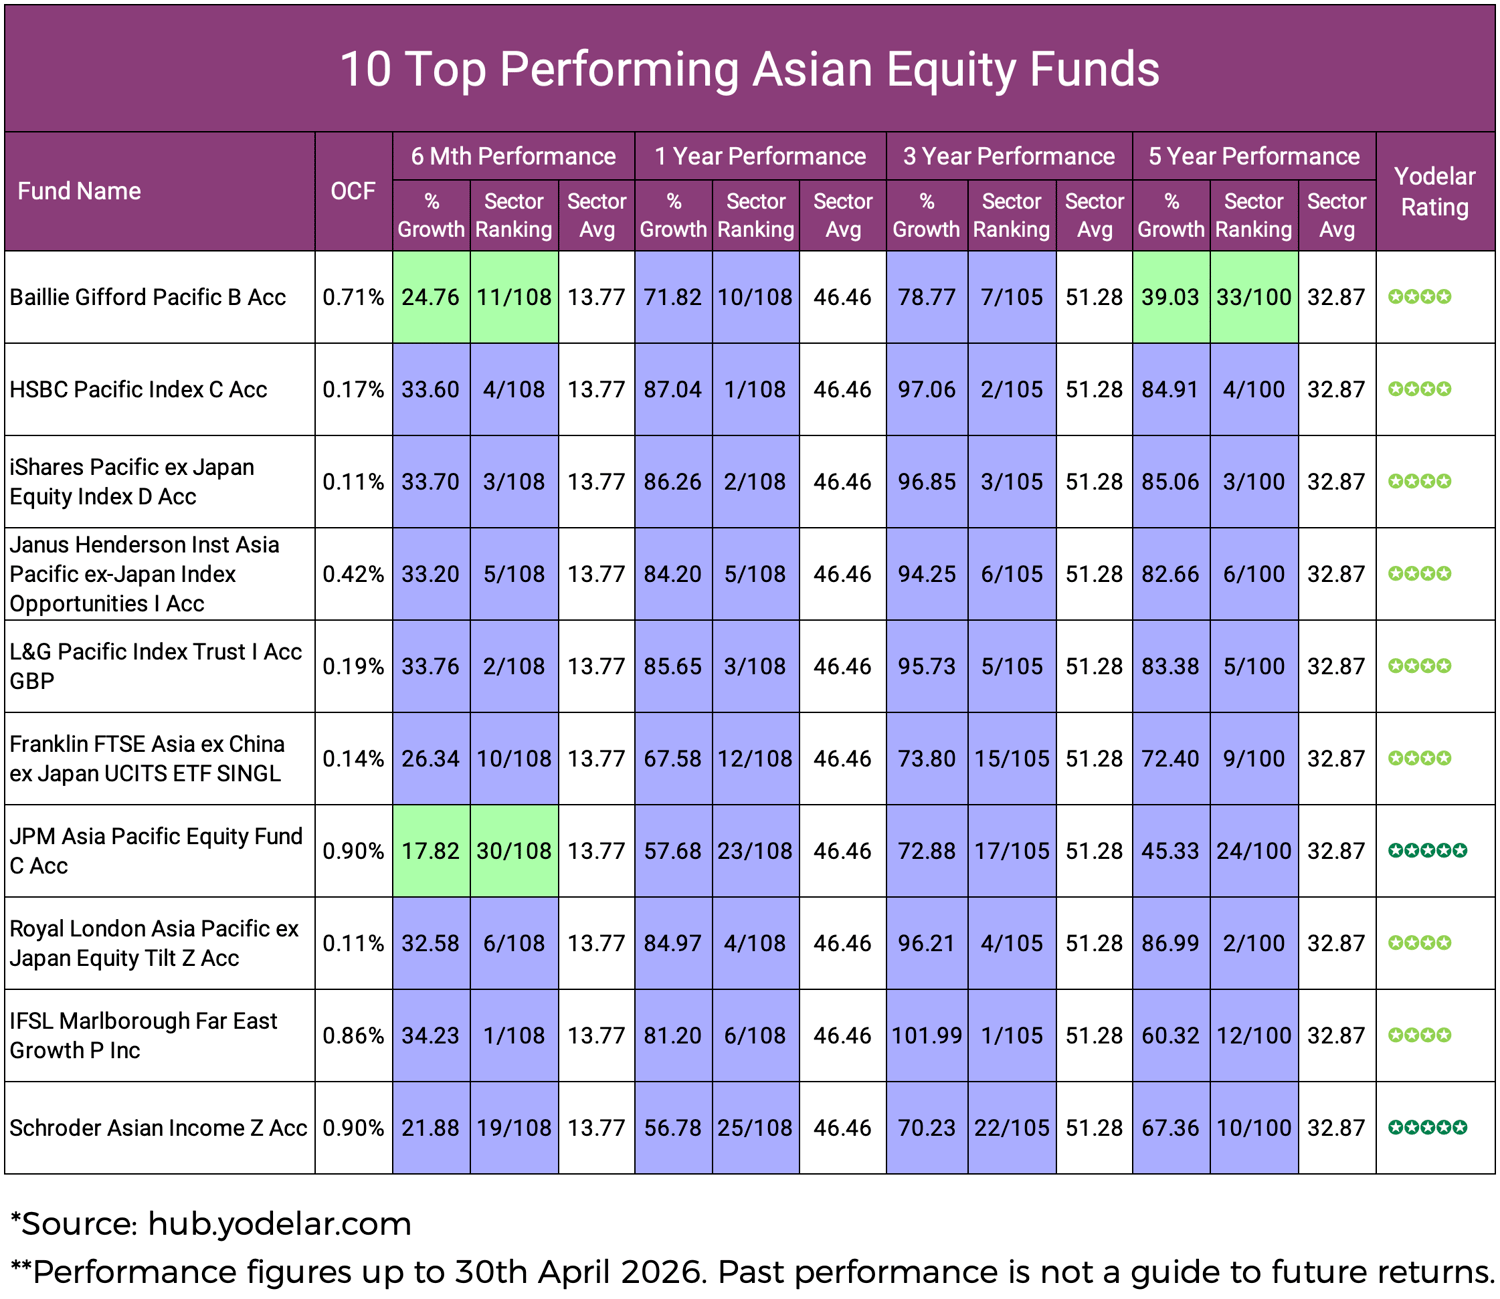
Baillie Gifford Pacific B Acc
Baillie Gifford Pacific returned 71.82% over one year, ranking 10th out of 108 funds. Over three years it returned 78.77%, ranking 7th out of 105, and over five years it returned 39.03%, ranking 33rd out of 100.
This is a fund where the manager is making the decisions rather than simply following an index. The one year and three year figures are strong, although the five year ranking is less convincing than several of the other funds featured here. Even so, it has still comfortably beaten the sector averages across all three periods.
HSBC Pacific Index C Acc
HSBC Pacific Index was one of the clearest standouts in the sector. It returned 87.04% over one year, ranking 1st out of 108 funds. Over three years it returned 97.06%, ranking 2nd out of 105, and over five years it returned 84.91%, ranking 4th out of 100.
This is a low cost fund that simply follows the market across Asia Pacific outside Japan. Its annual charge is also low at 0.17%. That matters because it shows that investors did not need a high cost, complicated approach to achieve top tier returns here. A simple, low cost route has been one of the strongest.
iShares Pacific ex Japan Equity Index D Acc
This fund returned 86.26% over one year, ranking 2nd out of 108 funds. Over three years it returned 96.85%, ranking 3rd out of 105, and over five years it returned 85.06%, ranking 3rd out of 100.
Like the HSBC fund, this is another low cost fund that follows the market rather than trying to outguess it. Its annual charge is just 0.11%, making it one of the cheapest funds in the group. The message is hard to ignore. In this sector, low cost market tracking has been extremely effective.
Janus Henderson Inst Asia Pacific ex-Japan Index Opportunities I Acc
Janus Henderson returned 84.20% over one year, ranking 5th out of 108 funds. Over three years it returned 94.25%, ranking 6th out of 105, and over five years it returned 82.66%, again ranking 6th out of 100.
This fund sits somewhere between a straight market tracker and a more hands on managed fund. It stays close to the market, but allows for some measured changes in an effort to improve returns. The result has been a very steady record across all the main periods, which is exactly what many investors want to see.
L&G Pacific Index Trust I Acc GBP
L&G Pacific Index Trust returned 85.65% over one year, ranking 3rd out of 108 funds. Over three years it returned 95.73%, ranking 5th out of 105, and over five years it returned 83.38%, ranking 5th out of 100.
This is another low cost fund that follows the market, with an annual charge of 0.19%. Its numbers are remarkably close to the HSBC and iShares funds, which strengthens the case that simple market tracking has been one of the most reliable ways to invest in this sector over recent years.
Franklin FTSE Asia ex China ex Japan UCITS ETF SINGL
Franklin returned 67.58% over one year, ranking 12th out of 108 funds. Over three years it returned 73.80%, ranking 15th out of 105, and over five years it returned 72.40%, ranking 9th out of 100.
The key difference here is that this fund excludes China as well as Japan. That gives it a different shape from many of the other funds in the sector. For investors who want Asia exposure but prefer not to rely on China, this may be one of the more interesting options. Its rankings remain strong across all three periods.
JPM Asia Pacific Equity Fund C Acc
JPM Asia Pacific Equity returned 57.68% over one year, ranking 23rd out of 108 funds. Over three years it returned 72.88%, ranking 17th out of 105, and over five years it returned 45.33%, ranking 24th out of 100.
These are not the very best numbers in the list, but they are still well above the sector averages. It also holds a 5 star Yodelar rating. That makes it an interesting example of a fund that may not have topped the performance tables, but has still delivered strong returns over all the main periods.
Royal London Asia Pacific ex Japan Equity Tilt Z Acc
Royal London Asia Pacific ex Japan Equity Tilt was one of the strongest all round funds in the review. It returned 84.97% over one year, ranking 4th out of 108 funds. Over three years it returned 96.21%, ranking 4th out of 105, and over five years it returned 86.99%, ranking 2nd out of 100.
This fund broadly follows the market, but allows for small adjustments rather than sticking to it exactly. That approach has worked extremely well. Its rankings have been strong across all three periods, and its five year figure was one of the best in the entire sector.
IFSL Marlborough Far East Growth P Inc
IFSL Marlborough Far East Growth returned 81.20% over one year, ranking 6th out of 108 funds. Over three years it returned 101.99%, ranking 1st out of 105, and over five years it returned 60.32%, ranking 12th out of 100.
This is one of the clearest examples of a manager chosen fund doing very well in a sector where low cost market trackers have also been strong. The main standout is the three year return, which was the highest in the sector. That makes it one of the most notable active funds in this review.
Schroder Asian Income Z Acc
Schroder Asian Income returned 56.78% over one year, ranking 25th out of 108 funds. Over three years it returned 70.23%, ranking 22nd out of 105, and over five years it returned 67.36%, ranking 10th out of 100.
This fund takes a different route from many of the others because it looks for companies paying income as well as offering growth. That makes its long term record particularly interesting. It shows that a more income focused approach has still been able to produce strong overall returns in this sector.
What The Strongest Funds Have In Common
The clearest pattern is that several of the strongest funds are low cost funds that simply follow the market. HSBC, iShares and L&G all fall into that group, and Royal London’s more lightly adjusted approach has also been very successful.
That does not mean manager run funds cannot do well. Marlborough is the obvious example that they can. But it does mean investors should not assume that paying more automatically leads to better results. In this sector, that has clearly not been the case.
The second pattern is that the stronger funds have not just had one good spell. They have remained competitive across more than one time period. That matters because a single strong year can flatter a fund. A fund that stays near the top over one, three and five years tells a much more useful story.
Why This Matters For Investors
The real question for most investors is not simply whether Asia Pacific ex Japan has done well. It is whether the fund they already hold is one of the stronger options, and whether it still deserves its place in the portfolio.
That is where a Yodelar portfolio analysis can be useful. It can show how each fund in a portfolio has ranked against others in the same sector. It can also highlight where funds overlap, where charges look high compared with similar options, and whether a portfolio is working together properly or simply repeating the same positions in different wrappers.
This matters more than many investors realise. A portfolio can look well spread on the surface, but still contain funds doing almost the same job. Equally, a strong sector does not automatically mean the fund held by the investor has kept up with the stronger names in that sector.
For investors who want a clearer view of how their holdings compare, or who want to understand whether there may be stronger alternatives elsewhere, a no obligation call with an FCA regulated adviser can help bring that into focus. The aim is not to chase whatever has gone up most recently. It is to understand whether your current portfolio is still fit for purpose.

Conclusion
Asia Pacific ex Japan is a sector that deserves far more attention than it often gets. The recent figures are strong enough on their own, but the bigger story is the size of the gap between the stronger funds and the rest.
HSBC Pacific Index, iShares Pacific ex Japan Equity Index, Royal London Asia Pacific ex Japan Equity Tilt, L&G Pacific Index Trust and Janus Henderson Index Opportunities have all shown how powerful a simple, low cost approach can be. At the same time, IFSL Marlborough Far East Growth and Schroder Asian Income show that manager run funds can still earn their place when the results are strong enough.
For investors, the wider point is straightforward. A strong sector still requires careful fund selection. And a strong fund still needs to be judged in the context of the wider portfolio.
That is why the next step is rarely just finding another performance table. It is understanding what you already hold, how it compares, and whether it is genuinely helping the wider portfolio do its job.


